Immigrants from Ecuador vs Shoshone 11th Grade
COMPARE
Immigrants from Ecuador
Shoshone
11th Grade
11th Grade Comparison
Immigrants from Ecuador
Shoshone
89.1%
11TH GRADE
0.0/ 100
METRIC RATING
315th/ 347
METRIC RANK
92.5%
11TH GRADE
48.9/ 100
METRIC RATING
175th/ 347
METRIC RANK
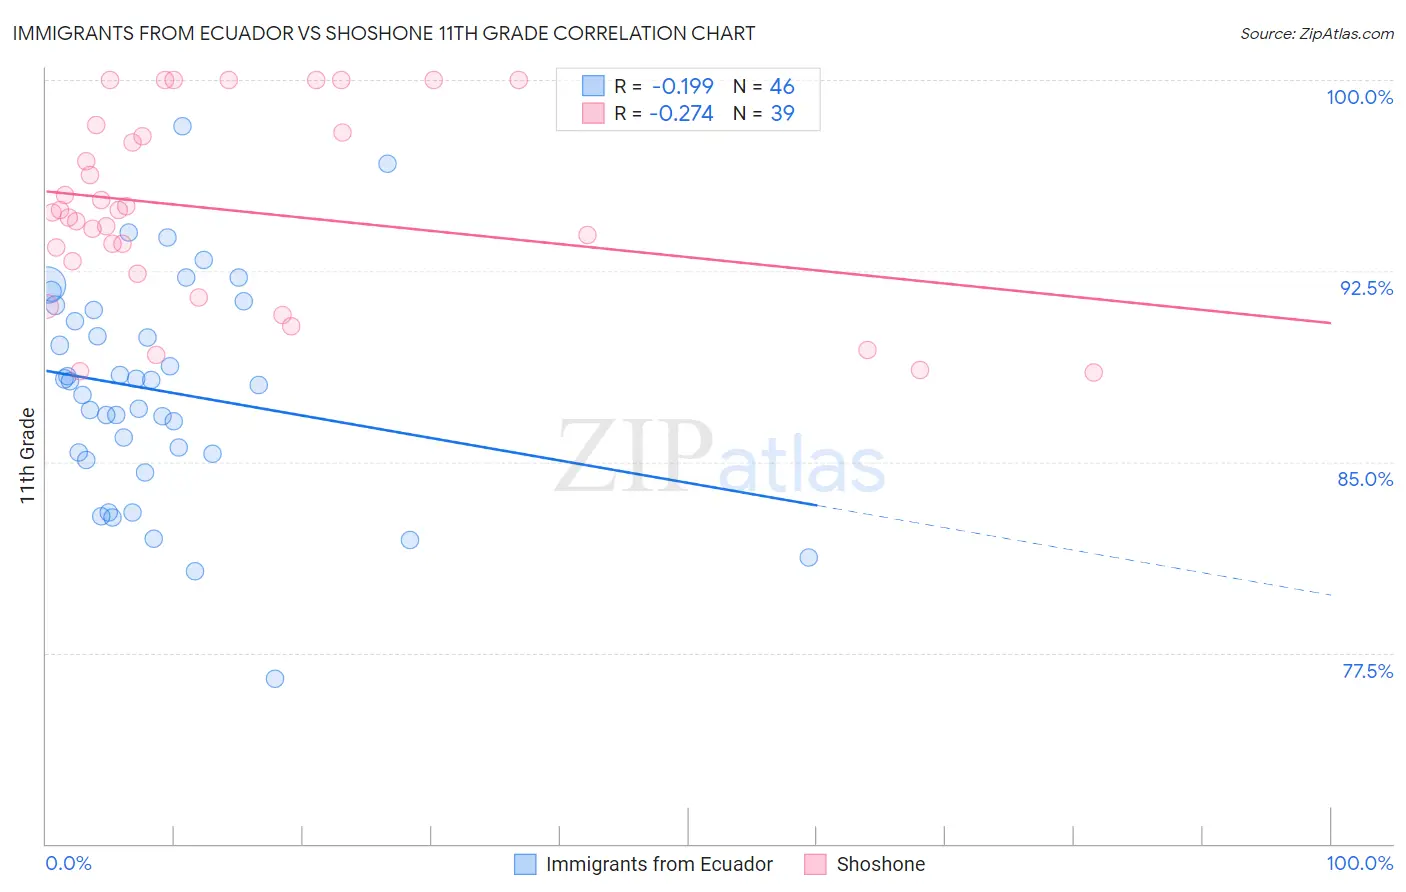
Immigrants from Ecuador vs Shoshone 11th Grade Correlation Chart
The statistical analysis conducted on geographies consisting of 270,907,929 people shows a poor negative correlation between the proportion of Immigrants from Ecuador and percentage of population with at least 11th grade education in the United States with a correlation coefficient (R) of -0.199 and weighted average of 89.1%. Similarly, the statistical analysis conducted on geographies consisting of 66,625,086 people shows a weak negative correlation between the proportion of Shoshone and percentage of population with at least 11th grade education in the United States with a correlation coefficient (R) of -0.274 and weighted average of 92.5%, a difference of 3.9%.
11th Grade Correlation Summary
| Measurement | Immigrants from Ecuador | Shoshone |
| Minimum | 76.5% | 88.5% |
| Maximum | 98.2% | 100.0% |
| Range | 21.7% | 11.5% |
| Mean | 87.8% | 94.9% |
| Median | 88.1% | 94.8% |
| Interquartile 25% (IQ1) | 85.3% | 92.4% |
| Interquartile 75% (IQ3) | 91.0% | 97.9% |
| Interquartile Range (IQR) | 5.7% | 5.5% |
| Standard Deviation (Sample) | 4.3% | 3.7% |
| Standard Deviation (Population) | 4.3% | 3.6% |
Similar Demographics by 11th Grade
Demographics Similar to Immigrants from Ecuador by 11th Grade
In terms of 11th grade, the demographic groups most similar to Immigrants from Ecuador are Cape Verdean (89.1%, a difference of 0.010%), Immigrants from Caribbean (89.1%, a difference of 0.030%), Immigrants from Cuba (88.9%, a difference of 0.15%), Lumbee (88.9%, a difference of 0.16%), and Nicaraguan (88.9%, a difference of 0.22%).
| Demographics | Rating | Rank | 11th Grade |
| Nepalese | 0.0 /100 | #308 | Tragic 89.5% |
| Immigrants | Bangladesh | 0.0 /100 | #309 | Tragic 89.5% |
| Yaqui | 0.0 /100 | #310 | Tragic 89.5% |
| Vietnamese | 0.0 /100 | #311 | Tragic 89.4% |
| Immigrants | Portugal | 0.0 /100 | #312 | Tragic 89.3% |
| Immigrants | Caribbean | 0.0 /100 | #313 | Tragic 89.1% |
| Cape Verdeans | 0.0 /100 | #314 | Tragic 89.1% |
| Immigrants | Ecuador | 0.0 /100 | #315 | Tragic 89.1% |
| Immigrants | Cuba | 0.0 /100 | #316 | Tragic 88.9% |
| Lumbee | 0.0 /100 | #317 | Tragic 88.9% |
| Nicaraguans | 0.0 /100 | #318 | Tragic 88.9% |
| Belizeans | 0.0 /100 | #319 | Tragic 88.8% |
| Immigrants | Armenia | 0.0 /100 | #320 | Tragic 88.8% |
| Immigrants | Belize | 0.0 /100 | #321 | Tragic 88.7% |
| Puerto Ricans | 0.0 /100 | #322 | Tragic 88.4% |
Demographics Similar to Shoshone by 11th Grade
In terms of 11th grade, the demographic groups most similar to Shoshone are Asian (92.5%, a difference of 0.010%), Spaniard (92.5%, a difference of 0.020%), Immigrants from Pakistan (92.5%, a difference of 0.030%), Indian (Asian) (92.5%, a difference of 0.030%), and Guamanian/Chamorro (92.5%, a difference of 0.040%).
| Demographics | Rating | Rank | 11th Grade |
| Sierra Leoneans | 58.7 /100 | #168 | Average 92.6% |
| Immigrants | Albania | 57.8 /100 | #169 | Average 92.6% |
| Immigrants | Northern Africa | 57.3 /100 | #170 | Average 92.6% |
| Laotians | 54.4 /100 | #171 | Average 92.6% |
| Immigrants | Pakistan | 52.3 /100 | #172 | Average 92.5% |
| Indians (Asian) | 51.5 /100 | #173 | Average 92.5% |
| Asians | 50.0 /100 | #174 | Average 92.5% |
| Shoshone | 48.9 /100 | #175 | Average 92.5% |
| Spaniards | 46.9 /100 | #176 | Average 92.5% |
| Guamanians/Chamorros | 45.0 /100 | #177 | Average 92.5% |
| Sudanese | 43.4 /100 | #178 | Average 92.5% |
| Creek | 40.9 /100 | #179 | Average 92.4% |
| Inupiat | 40.7 /100 | #180 | Average 92.4% |
| Cherokee | 40.7 /100 | #181 | Average 92.4% |
| Immigrants | Morocco | 38.6 /100 | #182 | Fair 92.4% |