Liberian vs Shoshone 11th Grade
COMPARE
Liberian
Shoshone
11th Grade
11th Grade Comparison
Liberians
Shoshone
92.3%
11TH GRADE
26.8/ 100
METRIC RATING
195th/ 347
METRIC RANK
92.5%
11TH GRADE
48.9/ 100
METRIC RATING
175th/ 347
METRIC RANK
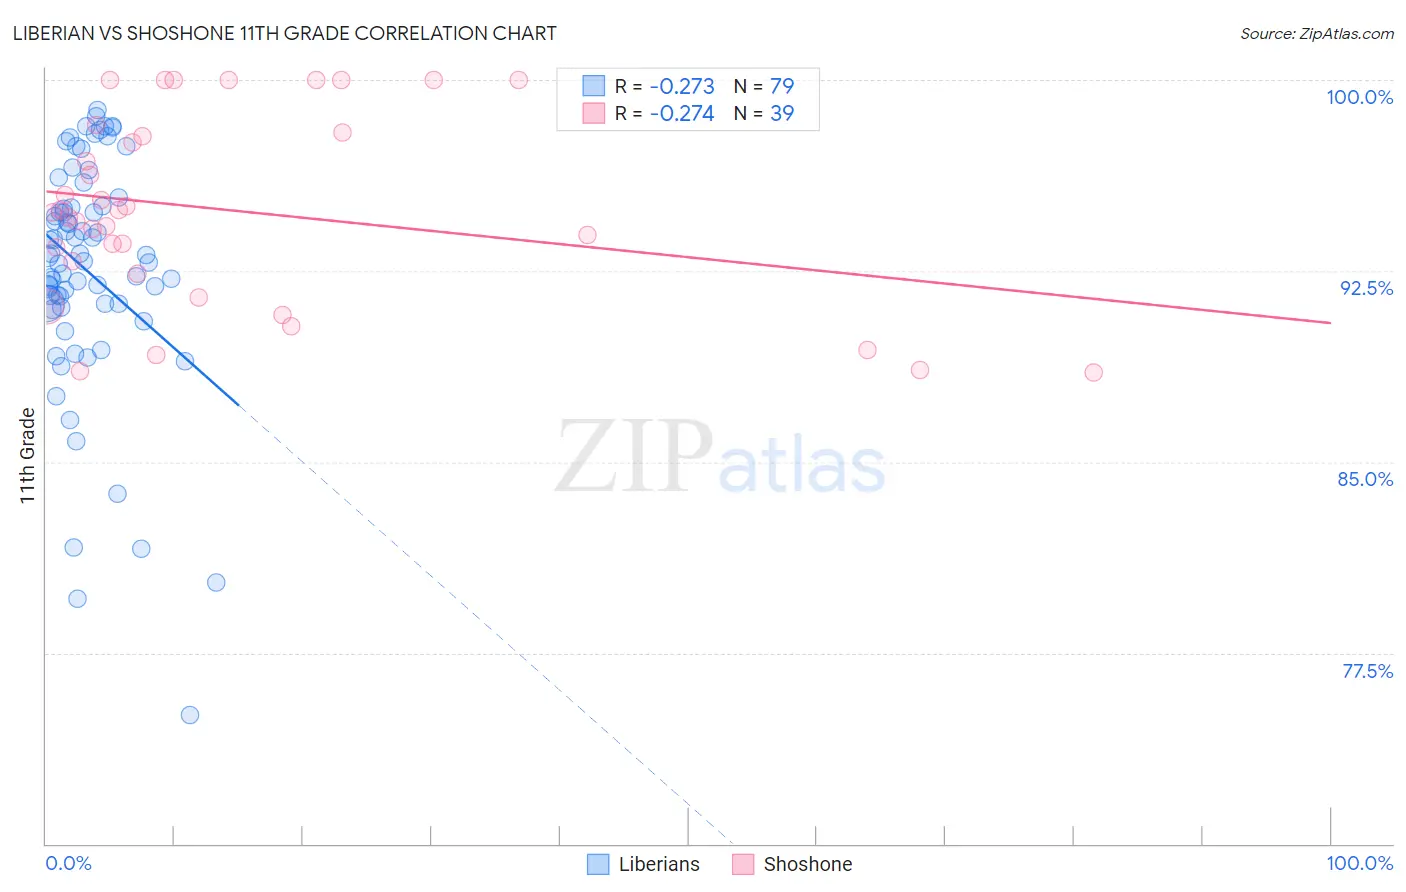
Liberian vs Shoshone 11th Grade Correlation Chart
The statistical analysis conducted on geographies consisting of 118,101,728 people shows a weak negative correlation between the proportion of Liberians and percentage of population with at least 11th grade education in the United States with a correlation coefficient (R) of -0.273 and weighted average of 92.3%. Similarly, the statistical analysis conducted on geographies consisting of 66,625,086 people shows a weak negative correlation between the proportion of Shoshone and percentage of population with at least 11th grade education in the United States with a correlation coefficient (R) of -0.274 and weighted average of 92.5%, a difference of 0.24%.
11th Grade Correlation Summary
| Measurement | Liberian | Shoshone |
| Minimum | 75.1% | 88.5% |
| Maximum | 98.8% | 100.0% |
| Range | 23.7% | 11.5% |
| Mean | 92.5% | 94.9% |
| Median | 93.1% | 94.8% |
| Interquartile 25% (IQ1) | 91.2% | 92.4% |
| Interquartile 75% (IQ3) | 95.1% | 97.9% |
| Interquartile Range (IQR) | 3.8% | 5.5% |
| Standard Deviation (Sample) | 4.6% | 3.7% |
| Standard Deviation (Population) | 4.6% | 3.6% |
Demographics Similar to Liberians and Shoshone by 11th Grade
In terms of 11th grade, the demographic groups most similar to Liberians are Moroccan (92.3%, a difference of 0.020%), Sioux (92.3%, a difference of 0.020%), Immigrants from Syria (92.3%, a difference of 0.040%), Chickasaw (92.3%, a difference of 0.050%), and French American Indian (92.3%, a difference of 0.050%). Similarly, the demographic groups most similar to Shoshone are Spaniard (92.5%, a difference of 0.020%), Guamanian/Chamorro (92.5%, a difference of 0.040%), Sudanese (92.5%, a difference of 0.060%), Creek (92.4%, a difference of 0.080%), and Inupiat (92.4%, a difference of 0.080%).
| Demographics | Rating | Rank | 11th Grade |
| Shoshone | 48.9 /100 | #175 | Average 92.5% |
| Spaniards | 46.9 /100 | #176 | Average 92.5% |
| Guamanians/Chamorros | 45.0 /100 | #177 | Average 92.5% |
| Sudanese | 43.4 /100 | #178 | Average 92.5% |
| Creek | 40.9 /100 | #179 | Average 92.4% |
| Inupiat | 40.7 /100 | #180 | Average 92.4% |
| Cherokee | 40.7 /100 | #181 | Average 92.4% |
| Immigrants | Morocco | 38.6 /100 | #182 | Fair 92.4% |
| Immigrants | Malaysia | 37.6 /100 | #183 | Fair 92.4% |
| Immigrants | Asia | 37.4 /100 | #184 | Fair 92.4% |
| Immigrants | Nepal | 36.4 /100 | #185 | Fair 92.4% |
| Arapaho | 35.1 /100 | #186 | Fair 92.4% |
| Immigrants | Western Asia | 35.0 /100 | #187 | Fair 92.4% |
| Immigrants | Indonesia | 33.7 /100 | #188 | Fair 92.4% |
| Immigrants | Chile | 33.3 /100 | #189 | Fair 92.4% |
| Chickasaw | 31.4 /100 | #190 | Fair 92.3% |
| French American Indians | 30.8 /100 | #191 | Fair 92.3% |
| Immigrants | Syria | 30.4 /100 | #192 | Fair 92.3% |
| Moroccans | 28.7 /100 | #193 | Fair 92.3% |
| Sioux | 28.5 /100 | #194 | Fair 92.3% |
| Liberians | 26.8 /100 | #195 | Fair 92.3% |