Immigrants vs Ukrainian 11th Grade
COMPARE
Immigrants
Ukrainian
11th Grade
11th Grade Comparison
Immigrants
Ukrainians
89.7%
11TH GRADE
0.0/ 100
METRIC RATING
303rd/ 347
METRIC RANK
94.0%
11TH GRADE
99.8/ 100
METRIC RATING
63rd/ 347
METRIC RANK
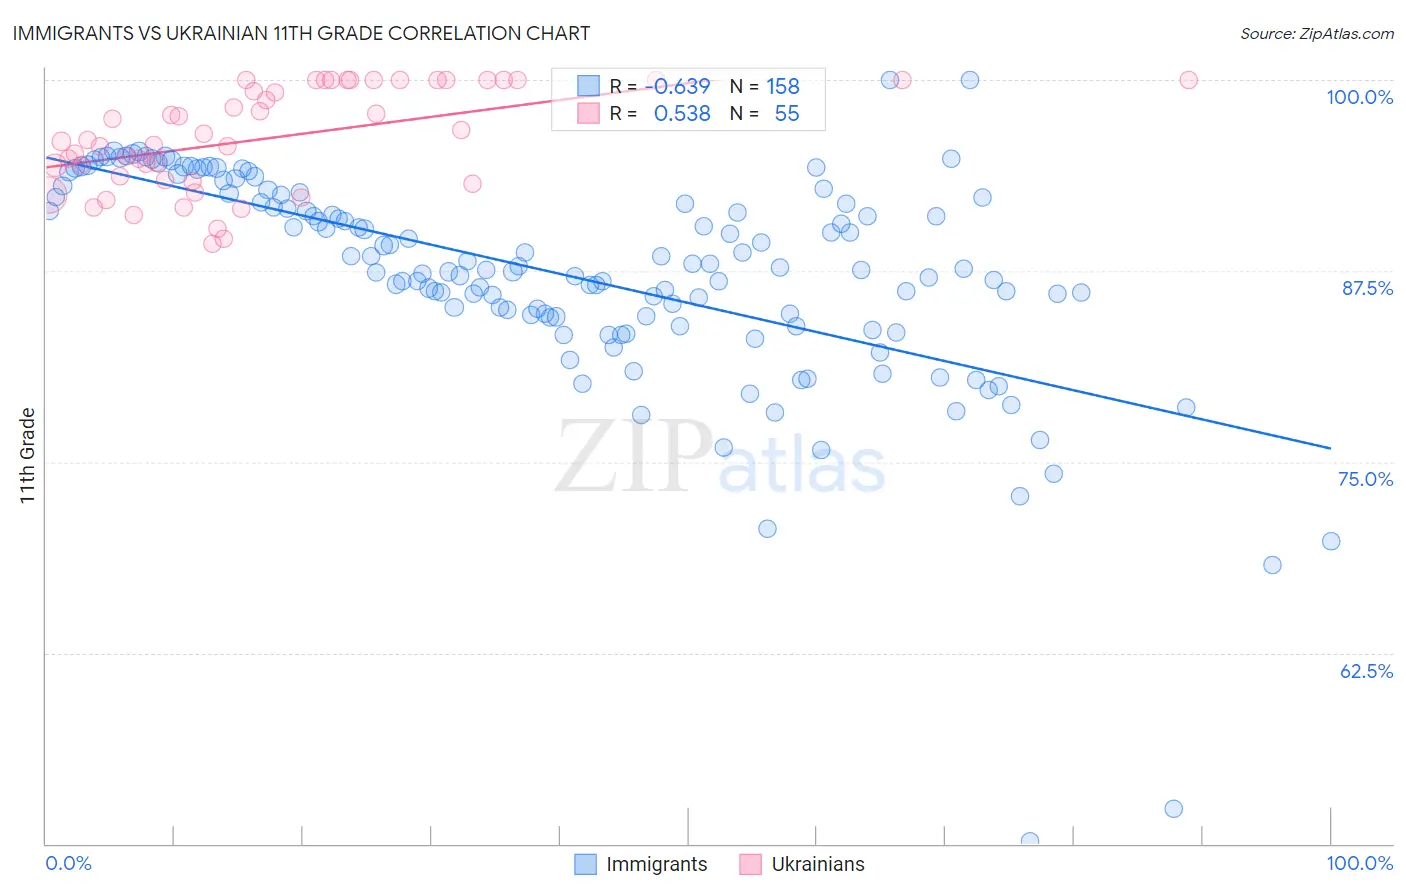
Immigrants vs Ukrainian 11th Grade Correlation Chart
The statistical analysis conducted on geographies consisting of 577,785,939 people shows a significant negative correlation between the proportion of Immigrants and percentage of population with at least 11th grade education in the United States with a correlation coefficient (R) of -0.639 and weighted average of 89.7%. Similarly, the statistical analysis conducted on geographies consisting of 448,696,775 people shows a substantial positive correlation between the proportion of Ukrainians and percentage of population with at least 11th grade education in the United States with a correlation coefficient (R) of 0.538 and weighted average of 94.0%, a difference of 4.7%.
11th Grade Correlation Summary
| Measurement | Immigrants | Ukrainian |
| Minimum | 50.2% | 89.3% |
| Maximum | 100.0% | 100.0% |
| Range | 49.8% | 10.7% |
| Mean | 87.3% | 96.2% |
| Median | 87.7% | 96.0% |
| Interquartile 25% (IQ1) | 84.6% | 93.4% |
| Interquartile 75% (IQ3) | 92.3% | 100.0% |
| Interquartile Range (IQR) | 7.8% | 6.6% |
| Standard Deviation (Sample) | 7.1% | 3.3% |
| Standard Deviation (Population) | 7.1% | 3.3% |
Similar Demographics by 11th Grade
Demographics Similar to Immigrants by 11th Grade
In terms of 11th grade, the demographic groups most similar to Immigrants are Yuman (89.7%, a difference of 0.0%), Immigrants from Guyana (89.7%, a difference of 0.010%), Immigrants from Cambodia (89.6%, a difference of 0.080%), Ecuadorian (89.6%, a difference of 0.13%), and Immigrants from Dominica (89.5%, a difference of 0.19%).
| Demographics | Rating | Rank | 11th Grade |
| Fijians | 0.0 /100 | #296 | Tragic 90.0% |
| Navajo | 0.0 /100 | #297 | Tragic 90.0% |
| Immigrants | Fiji | 0.0 /100 | #298 | Tragic 89.9% |
| Japanese | 0.0 /100 | #299 | Tragic 89.9% |
| Immigrants | Haiti | 0.0 /100 | #300 | Tragic 89.9% |
| Guyanese | 0.0 /100 | #301 | Tragic 89.9% |
| Immigrants | Guyana | 0.0 /100 | #302 | Tragic 89.7% |
| Immigrants | Immigrants | 0.0 /100 | #303 | Tragic 89.7% |
| Yuman | 0.0 /100 | #304 | Tragic 89.7% |
| Immigrants | Cambodia | 0.0 /100 | #305 | Tragic 89.6% |
| Ecuadorians | 0.0 /100 | #306 | Tragic 89.6% |
| Immigrants | Dominica | 0.0 /100 | #307 | Tragic 89.5% |
| Nepalese | 0.0 /100 | #308 | Tragic 89.5% |
| Immigrants | Bangladesh | 0.0 /100 | #309 | Tragic 89.5% |
| Yaqui | 0.0 /100 | #310 | Tragic 89.5% |
Demographics Similar to Ukrainians by 11th Grade
In terms of 11th grade, the demographic groups most similar to Ukrainians are Austrian (94.0%, a difference of 0.020%), Bhutanese (94.0%, a difference of 0.030%), Okinawan (94.0%, a difference of 0.030%), Immigrants from Belgium (94.0%, a difference of 0.030%), and Immigrants from Sweden (93.9%, a difference of 0.030%).
| Demographics | Rating | Rank | 11th Grade |
| French Canadians | 99.9 /100 | #56 | Exceptional 94.0% |
| New Zealanders | 99.9 /100 | #57 | Exceptional 94.0% |
| Iranians | 99.9 /100 | #58 | Exceptional 94.0% |
| Bhutanese | 99.8 /100 | #59 | Exceptional 94.0% |
| Okinawans | 99.8 /100 | #60 | Exceptional 94.0% |
| Immigrants | Belgium | 99.8 /100 | #61 | Exceptional 94.0% |
| Austrians | 99.8 /100 | #62 | Exceptional 94.0% |
| Ukrainians | 99.8 /100 | #63 | Exceptional 94.0% |
| Immigrants | Sweden | 99.8 /100 | #64 | Exceptional 93.9% |
| Native Hawaiians | 99.8 /100 | #65 | Exceptional 93.9% |
| Alaskan Athabascans | 99.8 /100 | #66 | Exceptional 93.9% |
| Immigrants | Netherlands | 99.8 /100 | #67 | Exceptional 93.9% |
| Zimbabweans | 99.8 /100 | #68 | Exceptional 93.9% |
| Scotch-Irish | 99.8 /100 | #69 | Exceptional 93.9% |
| Immigrants | England | 99.7 /100 | #70 | Exceptional 93.8% |