Immigrants vs Chilean 11th Grade
COMPARE
Immigrants
Chilean
11th Grade
11th Grade Comparison
Immigrants
Chileans
89.7%
11TH GRADE
0.0/ 100
METRIC RATING
303rd/ 347
METRIC RANK
92.9%
11TH GRADE
83.0/ 100
METRIC RATING
141st/ 347
METRIC RANK
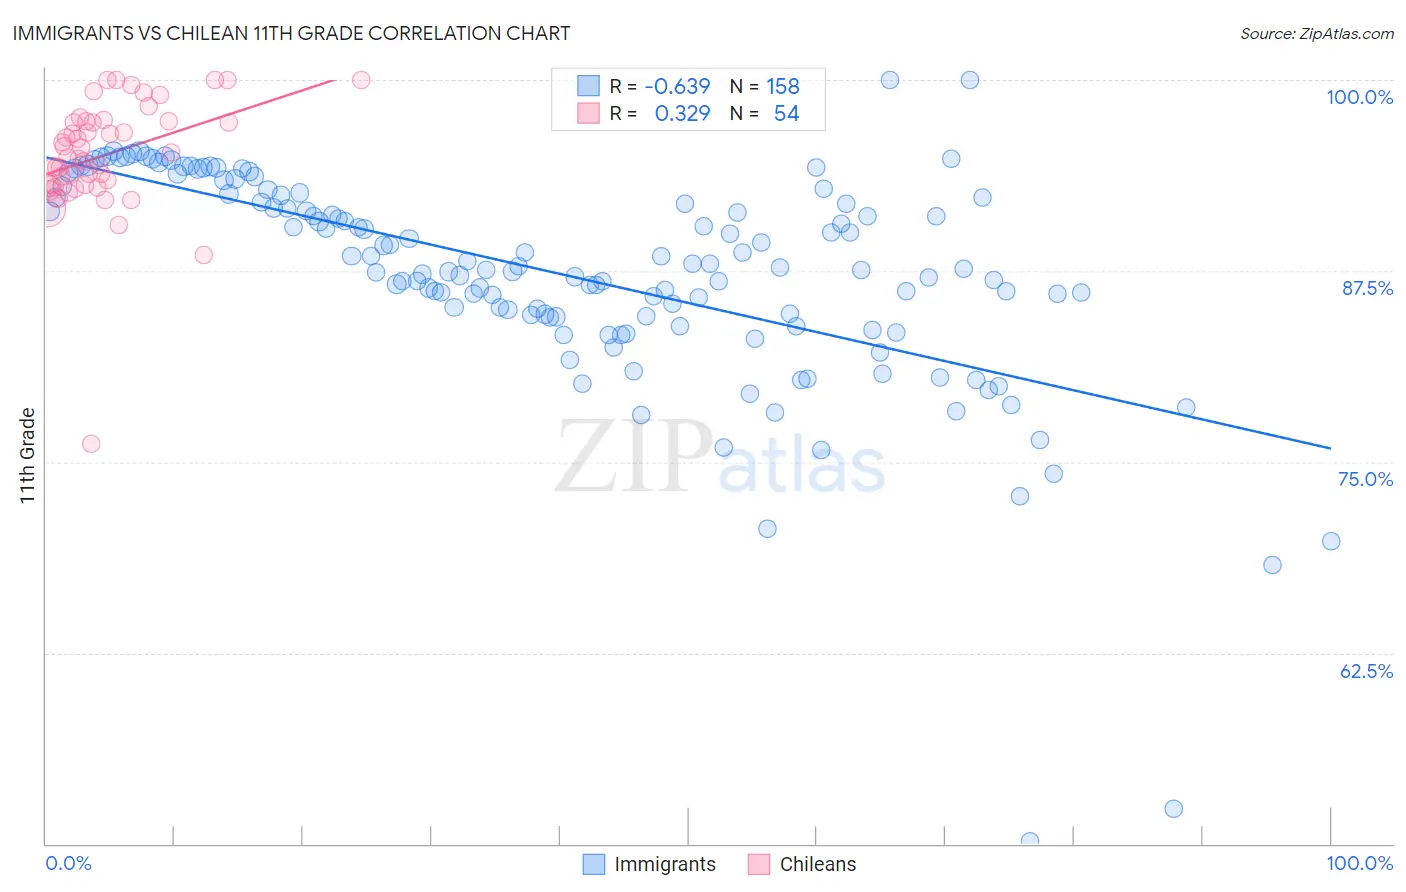
Immigrants vs Chilean 11th Grade Correlation Chart
The statistical analysis conducted on geographies consisting of 577,785,939 people shows a significant negative correlation between the proportion of Immigrants and percentage of population with at least 11th grade education in the United States with a correlation coefficient (R) of -0.639 and weighted average of 89.7%. Similarly, the statistical analysis conducted on geographies consisting of 256,683,580 people shows a mild positive correlation between the proportion of Chileans and percentage of population with at least 11th grade education in the United States with a correlation coefficient (R) of 0.329 and weighted average of 92.9%, a difference of 3.5%.
11th Grade Correlation Summary
| Measurement | Immigrants | Chilean |
| Minimum | 50.2% | 76.2% |
| Maximum | 100.0% | 100.0% |
| Range | 49.8% | 23.8% |
| Mean | 87.3% | 95.1% |
| Median | 87.7% | 95.1% |
| Interquartile 25% (IQ1) | 84.6% | 93.1% |
| Interquartile 75% (IQ3) | 92.3% | 97.3% |
| Interquartile Range (IQR) | 7.8% | 4.2% |
| Standard Deviation (Sample) | 7.1% | 3.8% |
| Standard Deviation (Population) | 7.1% | 3.7% |
Similar Demographics by 11th Grade
Demographics Similar to Immigrants by 11th Grade
In terms of 11th grade, the demographic groups most similar to Immigrants are Yuman (89.7%, a difference of 0.0%), Immigrants from Guyana (89.7%, a difference of 0.010%), Immigrants from Cambodia (89.6%, a difference of 0.080%), Ecuadorian (89.6%, a difference of 0.13%), and Immigrants from Dominica (89.5%, a difference of 0.19%).
| Demographics | Rating | Rank | 11th Grade |
| Fijians | 0.0 /100 | #296 | Tragic 90.0% |
| Navajo | 0.0 /100 | #297 | Tragic 90.0% |
| Immigrants | Fiji | 0.0 /100 | #298 | Tragic 89.9% |
| Japanese | 0.0 /100 | #299 | Tragic 89.9% |
| Immigrants | Haiti | 0.0 /100 | #300 | Tragic 89.9% |
| Guyanese | 0.0 /100 | #301 | Tragic 89.9% |
| Immigrants | Guyana | 0.0 /100 | #302 | Tragic 89.7% |
| Immigrants | Immigrants | 0.0 /100 | #303 | Tragic 89.7% |
| Yuman | 0.0 /100 | #304 | Tragic 89.7% |
| Immigrants | Cambodia | 0.0 /100 | #305 | Tragic 89.6% |
| Ecuadorians | 0.0 /100 | #306 | Tragic 89.6% |
| Immigrants | Dominica | 0.0 /100 | #307 | Tragic 89.5% |
| Nepalese | 0.0 /100 | #308 | Tragic 89.5% |
| Immigrants | Bangladesh | 0.0 /100 | #309 | Tragic 89.5% |
| Yaqui | 0.0 /100 | #310 | Tragic 89.5% |
Demographics Similar to Chileans by 11th Grade
In terms of 11th grade, the demographic groups most similar to Chileans are Venezuelan (92.9%, a difference of 0.010%), Crow (92.9%, a difference of 0.020%), Kenyan (92.9%, a difference of 0.020%), Ugandan (92.9%, a difference of 0.030%), and Immigrants from Brazil (92.9%, a difference of 0.040%).
| Demographics | Rating | Rank | 11th Grade |
| Delaware | 87.3 /100 | #134 | Excellent 93.0% |
| Immigrants | Italy | 86.6 /100 | #135 | Excellent 92.9% |
| Cree | 85.9 /100 | #136 | Excellent 92.9% |
| Arabs | 85.4 /100 | #137 | Excellent 92.9% |
| Immigrants | Brazil | 85.1 /100 | #138 | Excellent 92.9% |
| Crow | 84.1 /100 | #139 | Excellent 92.9% |
| Venezuelans | 83.4 /100 | #140 | Excellent 92.9% |
| Chileans | 83.0 /100 | #141 | Excellent 92.9% |
| Kenyans | 82.0 /100 | #142 | Excellent 92.9% |
| Ugandans | 81.4 /100 | #143 | Excellent 92.9% |
| Assyrians/Chaldeans/Syriacs | 80.5 /100 | #144 | Excellent 92.8% |
| Pakistanis | 79.6 /100 | #145 | Good 92.8% |
| Iroquois | 79.1 /100 | #146 | Good 92.8% |
| Immigrants | Kenya | 78.7 /100 | #147 | Good 92.8% |
| Hmong | 78.6 /100 | #148 | Good 92.8% |