Immigrants from Central America vs Fijian 11th Grade
COMPARE
Immigrants from Central America
Fijian
11th Grade
11th Grade Comparison
Immigrants from Central America
Fijians
84.9%
11TH GRADE
0.0/ 100
METRIC RATING
345th/ 347
METRIC RANK
90.0%
11TH GRADE
0.0/ 100
METRIC RATING
296th/ 347
METRIC RANK
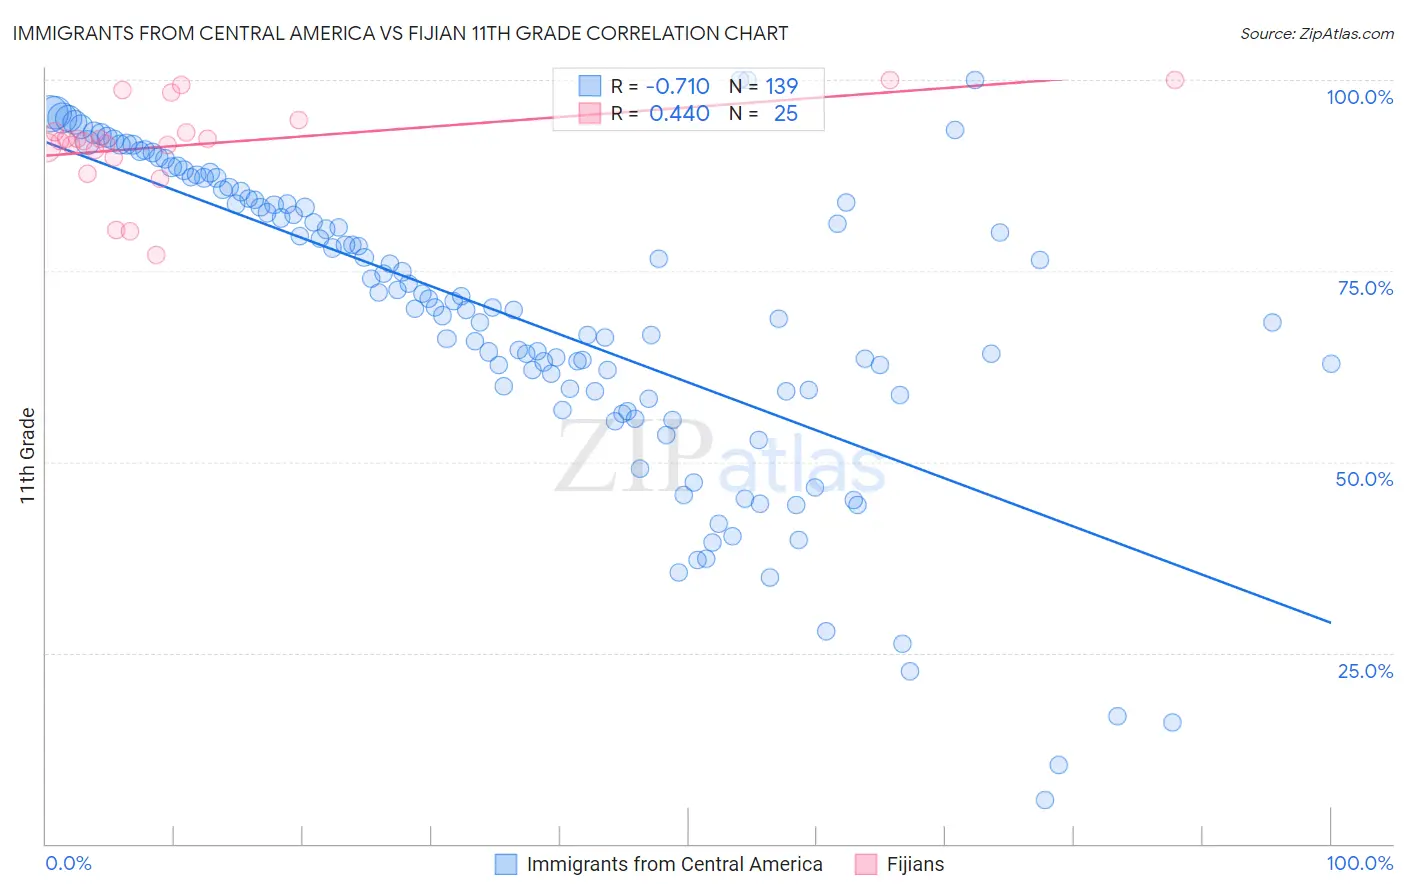
Immigrants from Central America vs Fijian 11th Grade Correlation Chart
The statistical analysis conducted on geographies consisting of 536,553,482 people shows a strong negative correlation between the proportion of Immigrants from Central America and percentage of population with at least 11th grade education in the United States with a correlation coefficient (R) of -0.710 and weighted average of 84.9%. Similarly, the statistical analysis conducted on geographies consisting of 55,948,842 people shows a moderate positive correlation between the proportion of Fijians and percentage of population with at least 11th grade education in the United States with a correlation coefficient (R) of 0.440 and weighted average of 90.0%, a difference of 6.0%.
11th Grade Correlation Summary
| Measurement | Immigrants from Central America | Fijian |
| Minimum | 5.7% | 77.1% |
| Maximum | 100.0% | 100.0% |
| Range | 94.3% | 22.9% |
| Mean | 69.1% | 91.6% |
| Median | 71.1% | 92.0% |
| Interquartile 25% (IQ1) | 59.2% | 90.4% |
| Interquartile 75% (IQ3) | 84.5% | 94.0% |
| Interquartile Range (IQR) | 25.2% | 3.6% |
| Standard Deviation (Sample) | 20.1% | 5.8% |
| Standard Deviation (Population) | 20.0% | 5.7% |
Similar Demographics by 11th Grade
Demographics Similar to Immigrants from Central America by 11th Grade
In terms of 11th grade, the demographic groups most similar to Immigrants from Central America are Yakama (85.0%, a difference of 0.030%), Spanish American Indian (84.7%, a difference of 0.24%), Immigrants from El Salvador (85.3%, a difference of 0.43%), Immigrants from Mexico (84.5%, a difference of 0.54%), and Immigrants from Guatemala (85.8%, a difference of 1.0%).
| Demographics | Rating | Rank | 11th Grade |
| Immigrants | Yemen | 0.0 /100 | #333 | Tragic 87.1% |
| Houma | 0.0 /100 | #334 | Tragic 87.0% |
| Central Americans | 0.0 /100 | #335 | Tragic 86.9% |
| Immigrants | Dominican Republic | 0.0 /100 | #336 | Tragic 86.9% |
| Immigrants | Honduras | 0.0 /100 | #337 | Tragic 86.9% |
| Immigrants | Latin America | 0.0 /100 | #338 | Tragic 86.8% |
| Guatemalans | 0.0 /100 | #339 | Tragic 86.4% |
| Salvadorans | 0.0 /100 | #340 | Tragic 86.2% |
| Mexicans | 0.0 /100 | #341 | Tragic 86.1% |
| Immigrants | Guatemala | 0.0 /100 | #342 | Tragic 85.8% |
| Immigrants | El Salvador | 0.0 /100 | #343 | Tragic 85.3% |
| Yakama | 0.0 /100 | #344 | Tragic 85.0% |
| Immigrants | Central America | 0.0 /100 | #345 | Tragic 84.9% |
| Spanish American Indians | 0.0 /100 | #346 | Tragic 84.7% |
| Immigrants | Mexico | 0.0 /100 | #347 | Tragic 84.5% |
Demographics Similar to Fijians by 11th Grade
In terms of 11th grade, the demographic groups most similar to Fijians are Immigrants from Vietnam (90.0%, a difference of 0.020%), Navajo (90.0%, a difference of 0.040%), Immigrants from Fiji (89.9%, a difference of 0.11%), Immigrants from Grenada (90.1%, a difference of 0.12%), and Japanese (89.9%, a difference of 0.14%).
| Demographics | Rating | Rank | 11th Grade |
| British West Indians | 0.0 /100 | #289 | Tragic 90.3% |
| Indonesians | 0.0 /100 | #290 | Tragic 90.3% |
| Haitians | 0.0 /100 | #291 | Tragic 90.3% |
| Cubans | 0.0 /100 | #292 | Tragic 90.2% |
| Natives/Alaskans | 0.0 /100 | #293 | Tragic 90.2% |
| Immigrants | Grenada | 0.0 /100 | #294 | Tragic 90.1% |
| Immigrants | Vietnam | 0.0 /100 | #295 | Tragic 90.0% |
| Fijians | 0.0 /100 | #296 | Tragic 90.0% |
| Navajo | 0.0 /100 | #297 | Tragic 90.0% |
| Immigrants | Fiji | 0.0 /100 | #298 | Tragic 89.9% |
| Japanese | 0.0 /100 | #299 | Tragic 89.9% |
| Immigrants | Haiti | 0.0 /100 | #300 | Tragic 89.9% |
| Guyanese | 0.0 /100 | #301 | Tragic 89.9% |
| Immigrants | Guyana | 0.0 /100 | #302 | Tragic 89.7% |
| Immigrants | Immigrants | 0.0 /100 | #303 | Tragic 89.7% |