Immigrants vs Fijian Single Father Households
COMPARE
Immigrants
Fijian
Single Father Households
Single Father Households Comparison
Immigrants
Fijians
2.5%
SINGLE FATHER HOUSEHOLDS
6.3/ 100
METRIC RATING
235th/ 347
METRIC RANK
3.0%
SINGLE FATHER HOUSEHOLDS
0.0/ 100
METRIC RATING
324th/ 347
METRIC RANK
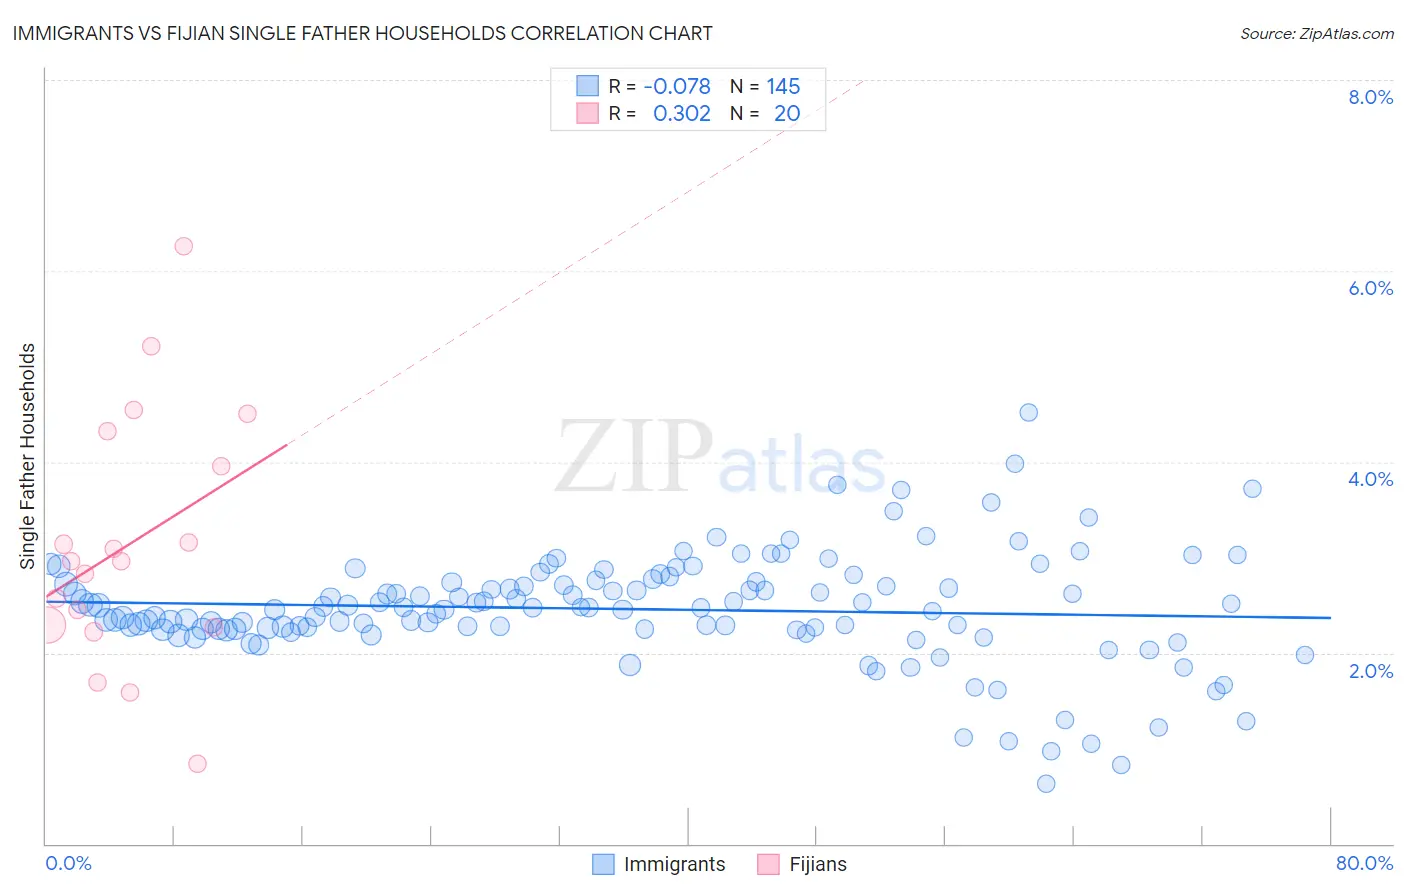
Immigrants vs Fijian Single Father Households Correlation Chart
The statistical analysis conducted on geographies consisting of 561,636,602 people shows a slight negative correlation between the proportion of Immigrants and percentage of single father households in the United States with a correlation coefficient (R) of -0.078 and weighted average of 2.5%. Similarly, the statistical analysis conducted on geographies consisting of 55,868,247 people shows a mild positive correlation between the proportion of Fijians and percentage of single father households in the United States with a correlation coefficient (R) of 0.302 and weighted average of 3.0%, a difference of 22.4%.
Single Father Households Correlation Summary
| Measurement | Immigrants | Fijian |
| Minimum | 0.62% | 0.84% |
| Maximum | 4.5% | 6.3% |
| Range | 3.9% | 5.4% |
| Mean | 2.5% | 3.1% |
| Median | 2.5% | 3.0% |
| Interquartile 25% (IQ1) | 2.2% | 2.3% |
| Interquartile 75% (IQ3) | 2.7% | 4.1% |
| Interquartile Range (IQR) | 0.49% | 1.9% |
| Standard Deviation (Sample) | 0.58% | 1.3% |
| Standard Deviation (Population) | 0.58% | 1.3% |
Similar Demographics by Single Father Households
Demographics Similar to Immigrants by Single Father Households
In terms of single father households, the demographic groups most similar to Immigrants are African (2.5%, a difference of 0.020%), Cajun (2.5%, a difference of 0.050%), Sierra Leonean (2.5%, a difference of 0.10%), Immigrants from Sierra Leone (2.5%, a difference of 0.13%), and Immigrants from Oceania (2.5%, a difference of 0.14%).
| Demographics | Rating | Rank | Single Father Households |
| Immigrants | Ghana | 9.1 /100 | #228 | Tragic 2.4% |
| Immigrants | Zaire | 8.6 /100 | #229 | Tragic 2.4% |
| Sub-Saharan Africans | 8.3 /100 | #230 | Tragic 2.4% |
| Immigrants | Nonimmigrants | 7.6 /100 | #231 | Tragic 2.4% |
| Pennsylvania Germans | 7.3 /100 | #232 | Tragic 2.4% |
| Immigrants | Western Africa | 7.0 /100 | #233 | Tragic 2.4% |
| Africans | 6.3 /100 | #234 | Tragic 2.5% |
| Immigrants | Immigrants | 6.3 /100 | #235 | Tragic 2.5% |
| Cajuns | 6.1 /100 | #236 | Tragic 2.5% |
| Sierra Leoneans | 5.9 /100 | #237 | Tragic 2.5% |
| Immigrants | Sierra Leone | 5.8 /100 | #238 | Tragic 2.5% |
| Immigrants | Oceania | 5.8 /100 | #239 | Tragic 2.5% |
| Immigrants | Dominica | 4.8 /100 | #240 | Tragic 2.5% |
| Portuguese | 4.1 /100 | #241 | Tragic 2.5% |
| Osage | 4.1 /100 | #242 | Tragic 2.5% |
Demographics Similar to Fijians by Single Father Households
In terms of single father households, the demographic groups most similar to Fijians are Immigrants from Central America (3.0%, a difference of 0.080%), Immigrants from Guatemala (3.0%, a difference of 0.39%), Mexican (3.0%, a difference of 0.92%), Immigrants from Mexico (3.0%, a difference of 1.2%), and Guatemalan (3.0%, a difference of 1.3%).
| Demographics | Rating | Rank | Single Father Households |
| Immigrants | El Salvador | 0.0 /100 | #317 | Tragic 2.9% |
| Cape Verdeans | 0.0 /100 | #318 | Tragic 2.9% |
| Ute | 0.0 /100 | #319 | Tragic 3.0% |
| Guatemalans | 0.0 /100 | #320 | Tragic 3.0% |
| Mexicans | 0.0 /100 | #321 | Tragic 3.0% |
| Immigrants | Guatemala | 0.0 /100 | #322 | Tragic 3.0% |
| Immigrants | Central America | 0.0 /100 | #323 | Tragic 3.0% |
| Fijians | 0.0 /100 | #324 | Tragic 3.0% |
| Immigrants | Mexico | 0.0 /100 | #325 | Tragic 3.0% |
| Aleuts | 0.0 /100 | #326 | Tragic 3.0% |
| Bangladeshis | 0.0 /100 | #327 | Tragic 3.1% |
| Immigrants | Cabo Verde | 0.0 /100 | #328 | Tragic 3.1% |
| Chippewa | 0.0 /100 | #329 | Tragic 3.1% |
| Nepalese | 0.0 /100 | #330 | Tragic 3.1% |
| Navajo | 0.0 /100 | #331 | Tragic 3.2% |