Hmong vs Fijian 11th Grade
COMPARE
Hmong
Fijian
11th Grade
11th Grade Comparison
Hmong
Fijians
92.8%
11TH GRADE
78.6/ 100
METRIC RATING
148th/ 347
METRIC RANK
90.0%
11TH GRADE
0.0/ 100
METRIC RATING
296th/ 347
METRIC RANK
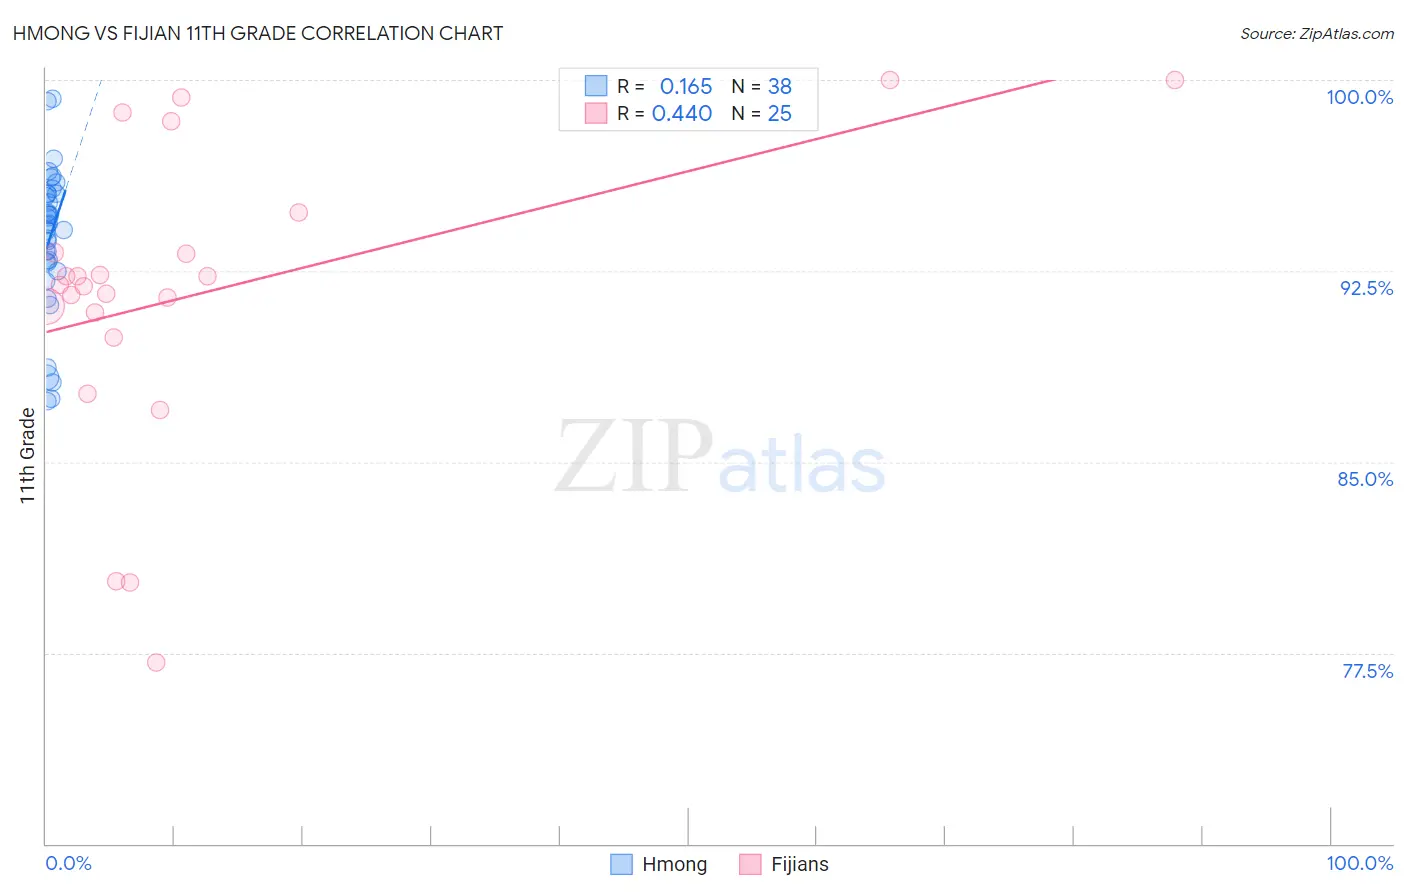
Hmong vs Fijian 11th Grade Correlation Chart
The statistical analysis conducted on geographies consisting of 24,672,093 people shows a poor positive correlation between the proportion of Hmong and percentage of population with at least 11th grade education in the United States with a correlation coefficient (R) of 0.165 and weighted average of 92.8%. Similarly, the statistical analysis conducted on geographies consisting of 55,948,842 people shows a moderate positive correlation between the proportion of Fijians and percentage of population with at least 11th grade education in the United States with a correlation coefficient (R) of 0.440 and weighted average of 90.0%, a difference of 3.1%.
11th Grade Correlation Summary
| Measurement | Hmong | Fijian |
| Minimum | 87.4% | 77.1% |
| Maximum | 99.2% | 100.0% |
| Range | 11.9% | 22.9% |
| Mean | 93.8% | 91.6% |
| Median | 94.3% | 92.0% |
| Interquartile 25% (IQ1) | 92.8% | 90.4% |
| Interquartile 75% (IQ3) | 95.5% | 94.0% |
| Interquartile Range (IQR) | 2.7% | 3.6% |
| Standard Deviation (Sample) | 2.9% | 5.8% |
| Standard Deviation (Population) | 2.8% | 5.7% |
Similar Demographics by 11th Grade
Demographics Similar to Hmong by 11th Grade
In terms of 11th grade, the demographic groups most similar to Hmong are Immigrants from Kenya (92.8%, a difference of 0.0%), Immigrants from Poland (92.8%, a difference of 0.0%), Iroquois (92.8%, a difference of 0.010%), Pakistani (92.8%, a difference of 0.020%), and Immigrants from Egypt (92.8%, a difference of 0.020%).
| Demographics | Rating | Rank | 11th Grade |
| Chileans | 83.0 /100 | #141 | Excellent 92.9% |
| Kenyans | 82.0 /100 | #142 | Excellent 92.9% |
| Ugandans | 81.4 /100 | #143 | Excellent 92.9% |
| Assyrians/Chaldeans/Syriacs | 80.5 /100 | #144 | Excellent 92.8% |
| Pakistanis | 79.6 /100 | #145 | Good 92.8% |
| Iroquois | 79.1 /100 | #146 | Good 92.8% |
| Immigrants | Kenya | 78.7 /100 | #147 | Good 92.8% |
| Hmong | 78.6 /100 | #148 | Good 92.8% |
| Immigrants | Poland | 78.5 /100 | #149 | Good 92.8% |
| Immigrants | Egypt | 77.5 /100 | #150 | Good 92.8% |
| Potawatomi | 74.3 /100 | #151 | Good 92.8% |
| Iraqis | 74.2 /100 | #152 | Good 92.8% |
| Brazilians | 73.9 /100 | #153 | Good 92.8% |
| Osage | 73.4 /100 | #154 | Good 92.7% |
| Argentineans | 73.4 /100 | #155 | Good 92.7% |
Demographics Similar to Fijians by 11th Grade
In terms of 11th grade, the demographic groups most similar to Fijians are Immigrants from Vietnam (90.0%, a difference of 0.020%), Navajo (90.0%, a difference of 0.040%), Immigrants from Fiji (89.9%, a difference of 0.11%), Immigrants from Grenada (90.1%, a difference of 0.12%), and Japanese (89.9%, a difference of 0.14%).
| Demographics | Rating | Rank | 11th Grade |
| British West Indians | 0.0 /100 | #289 | Tragic 90.3% |
| Indonesians | 0.0 /100 | #290 | Tragic 90.3% |
| Haitians | 0.0 /100 | #291 | Tragic 90.3% |
| Cubans | 0.0 /100 | #292 | Tragic 90.2% |
| Natives/Alaskans | 0.0 /100 | #293 | Tragic 90.2% |
| Immigrants | Grenada | 0.0 /100 | #294 | Tragic 90.1% |
| Immigrants | Vietnam | 0.0 /100 | #295 | Tragic 90.0% |
| Fijians | 0.0 /100 | #296 | Tragic 90.0% |
| Navajo | 0.0 /100 | #297 | Tragic 90.0% |
| Immigrants | Fiji | 0.0 /100 | #298 | Tragic 89.9% |
| Japanese | 0.0 /100 | #299 | Tragic 89.9% |
| Immigrants | Haiti | 0.0 /100 | #300 | Tragic 89.9% |
| Guyanese | 0.0 /100 | #301 | Tragic 89.9% |
| Immigrants | Guyana | 0.0 /100 | #302 | Tragic 89.7% |
| Immigrants | Immigrants | 0.0 /100 | #303 | Tragic 89.7% |