Immigrants from Zaire vs Carpatho Rusyn Unemployment Among Women with Children Ages 6 to 17 years
COMPARE
Immigrants from Zaire
Carpatho Rusyn
Unemployment Among Women with Children Ages 6 to 17 years
Unemployment Among Women with Children Ages 6 to 17 years Comparison
Immigrants from Zaire
Carpatho Rusyns
9.0%
UNEMPLOYMENT AMONG WOMEN WITH CHILDREN AGES 6 TO 17 YEARS
38.3/ 100
METRIC RATING
179th/ 347
METRIC RANK
10.0%
UNEMPLOYMENT AMONG WOMEN WITH CHILDREN AGES 6 TO 17 YEARS
0.0/ 100
METRIC RATING
292nd/ 347
METRIC RANK
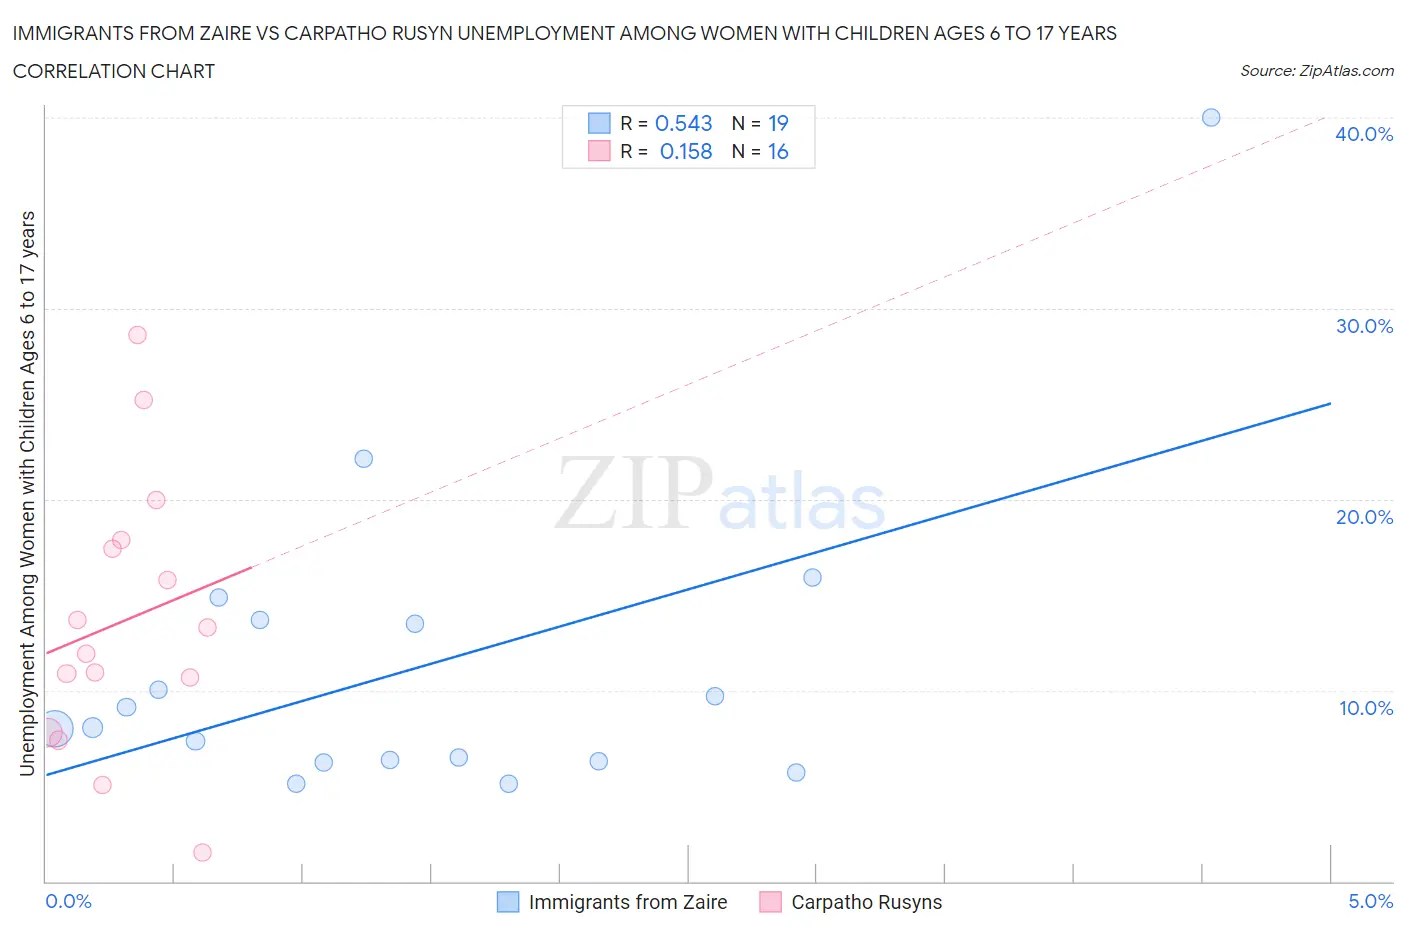
Immigrants from Zaire vs Carpatho Rusyn Unemployment Among Women with Children Ages 6 to 17 years Correlation Chart
The statistical analysis conducted on geographies consisting of 94,396,135 people shows a substantial positive correlation between the proportion of Immigrants from Zaire and unemployment rate among women with children between the ages 6 and 17 in the United States with a correlation coefficient (R) of 0.543 and weighted average of 9.0%. Similarly, the statistical analysis conducted on geographies consisting of 51,221,084 people shows a poor positive correlation between the proportion of Carpatho Rusyns and unemployment rate among women with children between the ages 6 and 17 in the United States with a correlation coefficient (R) of 0.158 and weighted average of 10.0%, a difference of 11.0%.
Unemployment Among Women with Children Ages 6 to 17 years Correlation Summary
| Measurement | Immigrants from Zaire | Carpatho Rusyn |
| Minimum | 5.1% | 1.5% |
| Maximum | 40.0% | 28.6% |
| Range | 34.9% | 27.1% |
| Mean | 11.2% | 13.6% |
| Median | 8.0% | 12.6% |
| Interquartile 25% (IQ1) | 6.3% | 9.2% |
| Interquartile 75% (IQ3) | 13.7% | 17.6% |
| Interquartile Range (IQR) | 7.4% | 8.4% |
| Standard Deviation (Sample) | 8.3% | 7.1% |
| Standard Deviation (Population) | 8.1% | 6.9% |
Similar Demographics by Unemployment Among Women with Children Ages 6 to 17 years
Demographics Similar to Immigrants from Zaire by Unemployment Among Women with Children Ages 6 to 17 years
In terms of unemployment among women with children ages 6 to 17 years, the demographic groups most similar to Immigrants from Zaire are Ethiopian (9.0%, a difference of 0.030%), Menominee (9.0%, a difference of 0.040%), Immigrants from Jordan (9.0%, a difference of 0.15%), Immigrants from Czechoslovakia (9.0%, a difference of 0.18%), and South American Indian (9.0%, a difference of 0.19%).
| Demographics | Rating | Rank | Unemployment Among Women with Children Ages 6 to 17 years |
| Immigrants | West Indies | 52.2 /100 | #172 | Average 9.0% |
| Immigrants | Brazil | 51.0 /100 | #173 | Average 9.0% |
| Immigrants | Costa Rica | 50.0 /100 | #174 | Average 9.0% |
| Immigrants | Sierra Leone | 45.9 /100 | #175 | Average 9.0% |
| Immigrants | Italy | 43.7 /100 | #176 | Average 9.0% |
| Immigrants | Jordan | 41.6 /100 | #177 | Average 9.0% |
| Menominee | 39.3 /100 | #178 | Fair 9.0% |
| Immigrants | Zaire | 38.3 /100 | #179 | Fair 9.0% |
| Ethiopians | 37.6 /100 | #180 | Fair 9.0% |
| Immigrants | Czechoslovakia | 34.5 /100 | #181 | Fair 9.0% |
| South American Indians | 34.4 /100 | #182 | Fair 9.0% |
| Swiss | 33.5 /100 | #183 | Fair 9.0% |
| Palestinians | 33.4 /100 | #184 | Fair 9.0% |
| Immigrants | Congo | 32.5 /100 | #185 | Fair 9.0% |
| Immigrants | Spain | 32.4 /100 | #186 | Fair 9.0% |
Demographics Similar to Carpatho Rusyns by Unemployment Among Women with Children Ages 6 to 17 years
In terms of unemployment among women with children ages 6 to 17 years, the demographic groups most similar to Carpatho Rusyns are Nonimmigrants (10.0%, a difference of 0.010%), Subsaharan African (10.0%, a difference of 0.030%), Honduran (10.0%, a difference of 0.050%), Haitian (10.0%, a difference of 0.090%), and Ecuadorian (10.0%, a difference of 0.18%).
| Demographics | Rating | Rank | Unemployment Among Women with Children Ages 6 to 17 years |
| Hispanics or Latinos | 0.0 /100 | #285 | Tragic 9.9% |
| Choctaw | 0.0 /100 | #286 | Tragic 9.9% |
| Sierra Leoneans | 0.0 /100 | #287 | Tragic 9.9% |
| Shoshone | 0.0 /100 | #288 | Tragic 10.0% |
| Hondurans | 0.0 /100 | #289 | Tragic 10.0% |
| Sub-Saharan Africans | 0.0 /100 | #290 | Tragic 10.0% |
| Immigrants | Nonimmigrants | 0.0 /100 | #291 | Tragic 10.0% |
| Carpatho Rusyns | 0.0 /100 | #292 | Tragic 10.0% |
| Haitians | 0.0 /100 | #293 | Tragic 10.0% |
| Ecuadorians | 0.0 /100 | #294 | Tragic 10.0% |
| Cherokee | 0.0 /100 | #295 | Tragic 10.0% |
| Immigrants | Western Africa | 0.0 /100 | #296 | Tragic 10.1% |
| Immigrants | Caribbean | 0.0 /100 | #297 | Tragic 10.1% |
| Immigrants | Haiti | 0.0 /100 | #298 | Tragic 10.1% |
| Immigrants | Honduras | 0.0 /100 | #299 | Tragic 10.1% |