Immigrants from Yemen vs U.S. Virgin Islander College, Under 1 year
COMPARE
Immigrants from Yemen
U.S. Virgin Islander
College, Under 1 year
College, Under 1 year Comparison
Immigrants from Yemen
U.S. Virgin Islanders
55.3%
COLLEGE, UNDER 1 YEAR
0.0/ 100
METRIC RATING
332nd/ 347
METRIC RANK
60.6%
COLLEGE, UNDER 1 YEAR
0.1/ 100
METRIC RATING
271st/ 347
METRIC RANK
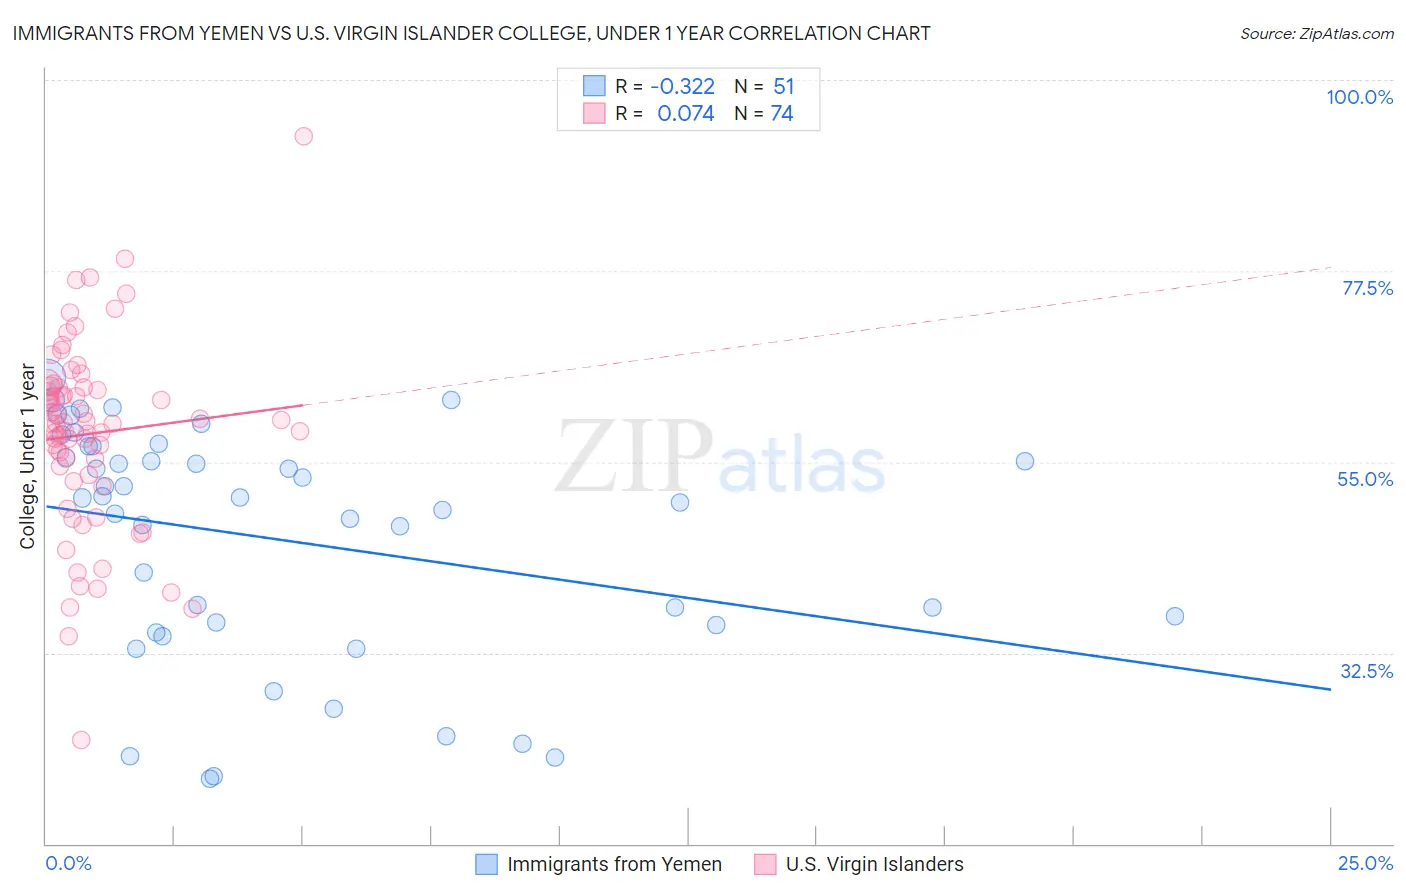
Immigrants from Yemen vs U.S. Virgin Islander College, Under 1 year Correlation Chart
The statistical analysis conducted on geographies consisting of 82,433,611 people shows a mild negative correlation between the proportion of Immigrants from Yemen and percentage of population with at least college, under 1 year education in the United States with a correlation coefficient (R) of -0.322 and weighted average of 55.3%. Similarly, the statistical analysis conducted on geographies consisting of 87,526,675 people shows a slight positive correlation between the proportion of U.S. Virgin Islanders and percentage of population with at least college, under 1 year education in the United States with a correlation coefficient (R) of 0.074 and weighted average of 60.6%, a difference of 9.6%.
College, Under 1 year Correlation Summary
| Measurement | Immigrants from Yemen | U.S. Virgin Islander |
| Minimum | 17.6% | 22.2% |
| Maximum | 65.0% | 93.4% |
| Range | 47.3% | 71.2% |
| Mean | 45.9% | 58.3% |
| Median | 50.8% | 59.5% |
| Interquartile 25% (IQ1) | 35.8% | 53.4% |
| Interquartile 75% (IQ3) | 56.8% | 63.8% |
| Interquartile Range (IQR) | 21.0% | 10.4% |
| Standard Deviation (Sample) | 13.6% | 11.3% |
| Standard Deviation (Population) | 13.5% | 11.3% |
Similar Demographics by College, Under 1 year
Demographics Similar to Immigrants from Yemen by College, Under 1 year
In terms of college, under 1 year, the demographic groups most similar to Immigrants from Yemen are Yuman (55.1%, a difference of 0.32%), Dominican (55.5%, a difference of 0.41%), Mexican (55.6%, a difference of 0.67%), Immigrants from Cuba (55.7%, a difference of 0.80%), and Immigrants from the Azores (54.7%, a difference of 1.1%).
| Demographics | Rating | Rank | College, Under 1 year |
| Immigrants | Latin America | 0.0 /100 | #325 | Tragic 56.3% |
| Navajo | 0.0 /100 | #326 | Tragic 56.3% |
| Immigrants | Guatemala | 0.0 /100 | #327 | Tragic 56.2% |
| Cape Verdeans | 0.0 /100 | #328 | Tragic 56.0% |
| Immigrants | Cuba | 0.0 /100 | #329 | Tragic 55.7% |
| Mexicans | 0.0 /100 | #330 | Tragic 55.6% |
| Dominicans | 0.0 /100 | #331 | Tragic 55.5% |
| Immigrants | Yemen | 0.0 /100 | #332 | Tragic 55.3% |
| Yuman | 0.0 /100 | #333 | Tragic 55.1% |
| Immigrants | Azores | 0.0 /100 | #334 | Tragic 54.7% |
| Inupiat | 0.0 /100 | #335 | Tragic 54.6% |
| Pennsylvania Germans | 0.0 /100 | #336 | Tragic 54.5% |
| Immigrants | Central America | 0.0 /100 | #337 | Tragic 54.4% |
| Lumbee | 0.0 /100 | #338 | Tragic 54.2% |
| Immigrants | Dominican Republic | 0.0 /100 | #339 | Tragic 54.0% |
Demographics Similar to U.S. Virgin Islanders by College, Under 1 year
In terms of college, under 1 year, the demographic groups most similar to U.S. Virgin Islanders are Cheyenne (60.6%, a difference of 0.020%), Immigrants from West Indies (60.6%, a difference of 0.13%), Jamaican (60.5%, a difference of 0.16%), Chickasaw (60.4%, a difference of 0.20%), and Alaska Native (60.4%, a difference of 0.20%).
| Demographics | Rating | Rank | College, Under 1 year |
| Trinidadians and Tobagonians | 0.2 /100 | #264 | Tragic 61.1% |
| Immigrants | Bahamas | 0.2 /100 | #265 | Tragic 61.1% |
| Alaskan Athabascans | 0.2 /100 | #266 | Tragic 61.0% |
| Americans | 0.2 /100 | #267 | Tragic 61.0% |
| Immigrants | Trinidad and Tobago | 0.1 /100 | #268 | Tragic 60.7% |
| Immigrants | West Indies | 0.1 /100 | #269 | Tragic 60.6% |
| Cheyenne | 0.1 /100 | #270 | Tragic 60.6% |
| U.S. Virgin Islanders | 0.1 /100 | #271 | Tragic 60.6% |
| Jamaicans | 0.1 /100 | #272 | Tragic 60.5% |
| Chickasaw | 0.1 /100 | #273 | Tragic 60.4% |
| Alaska Natives | 0.1 /100 | #274 | Tragic 60.4% |
| Immigrants | Barbados | 0.1 /100 | #275 | Tragic 60.4% |
| Arapaho | 0.1 /100 | #276 | Tragic 60.3% |
| Bahamians | 0.1 /100 | #277 | Tragic 60.3% |
| Yaqui | 0.1 /100 | #278 | Tragic 60.2% |