Cajun vs U.S. Virgin Islander College, Under 1 year
COMPARE
Cajun
U.S. Virgin Islander
College, Under 1 year
College, Under 1 year Comparison
Cajuns
U.S. Virgin Islanders
57.3%
COLLEGE, UNDER 1 YEAR
0.0/ 100
METRIC RATING
311th/ 347
METRIC RANK
60.6%
COLLEGE, UNDER 1 YEAR
0.1/ 100
METRIC RATING
271st/ 347
METRIC RANK
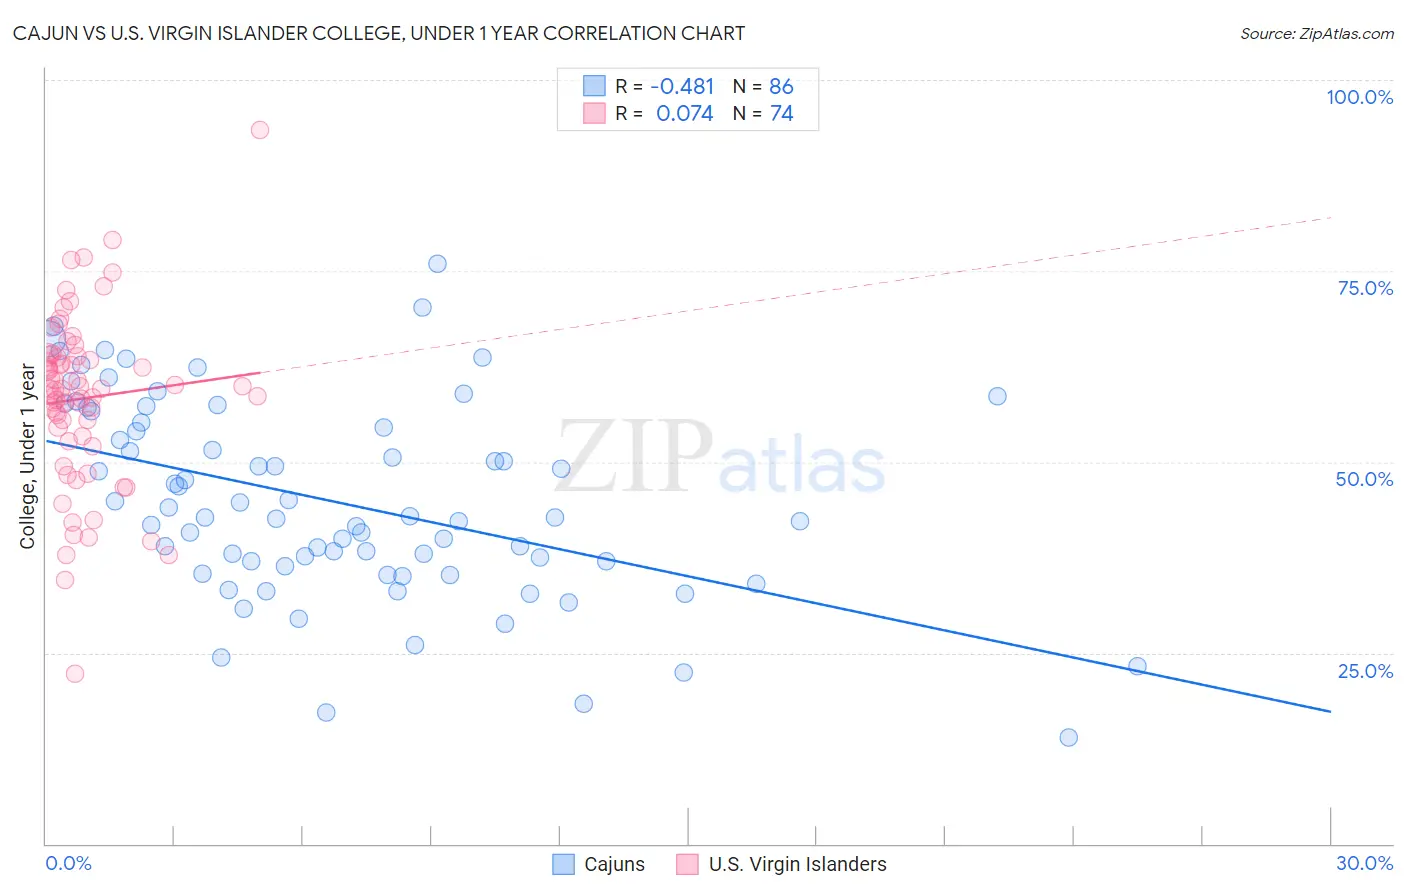
Cajun vs U.S. Virgin Islander College, Under 1 year Correlation Chart
The statistical analysis conducted on geographies consisting of 149,713,149 people shows a moderate negative correlation between the proportion of Cajuns and percentage of population with at least college, under 1 year education in the United States with a correlation coefficient (R) of -0.481 and weighted average of 57.3%. Similarly, the statistical analysis conducted on geographies consisting of 87,526,675 people shows a slight positive correlation between the proportion of U.S. Virgin Islanders and percentage of population with at least college, under 1 year education in the United States with a correlation coefficient (R) of 0.074 and weighted average of 60.6%, a difference of 5.6%.
College, Under 1 year Correlation Summary
| Measurement | Cajun | U.S. Virgin Islander |
| Minimum | 13.9% | 22.2% |
| Maximum | 75.9% | 93.4% |
| Range | 62.0% | 71.2% |
| Mean | 44.8% | 58.3% |
| Median | 42.7% | 59.5% |
| Interquartile 25% (IQ1) | 36.3% | 53.4% |
| Interquartile 75% (IQ3) | 55.2% | 63.8% |
| Interquartile Range (IQR) | 18.9% | 10.4% |
| Standard Deviation (Sample) | 13.0% | 11.3% |
| Standard Deviation (Population) | 12.9% | 11.3% |
Similar Demographics by College, Under 1 year
Demographics Similar to Cajuns by College, Under 1 year
In terms of college, under 1 year, the demographic groups most similar to Cajuns are Pueblo (57.4%, a difference of 0.060%), Salvadoran (57.3%, a difference of 0.070%), Dutch West Indian (57.2%, a difference of 0.31%), Hopi (57.1%, a difference of 0.42%), and Immigrants from Nicaragua (57.6%, a difference of 0.45%).
| Demographics | Rating | Rank | College, Under 1 year |
| Kiowa | 0.0 /100 | #304 | Tragic 57.8% |
| Haitians | 0.0 /100 | #305 | Tragic 57.8% |
| Immigrants | Portugal | 0.0 /100 | #306 | Tragic 57.7% |
| Fijians | 0.0 /100 | #307 | Tragic 57.7% |
| Central Americans | 0.0 /100 | #308 | Tragic 57.7% |
| Immigrants | Nicaragua | 0.0 /100 | #309 | Tragic 57.6% |
| Pueblo | 0.0 /100 | #310 | Tragic 57.4% |
| Cajuns | 0.0 /100 | #311 | Tragic 57.3% |
| Salvadorans | 0.0 /100 | #312 | Tragic 57.3% |
| Dutch West Indians | 0.0 /100 | #313 | Tragic 57.2% |
| Hopi | 0.0 /100 | #314 | Tragic 57.1% |
| Hondurans | 0.0 /100 | #315 | Tragic 57.1% |
| Menominee | 0.0 /100 | #316 | Tragic 57.0% |
| Hispanics or Latinos | 0.0 /100 | #317 | Tragic 57.0% |
| Immigrants | Haiti | 0.0 /100 | #318 | Tragic 56.9% |
Demographics Similar to U.S. Virgin Islanders by College, Under 1 year
In terms of college, under 1 year, the demographic groups most similar to U.S. Virgin Islanders are Cheyenne (60.6%, a difference of 0.020%), Immigrants from West Indies (60.6%, a difference of 0.13%), Jamaican (60.5%, a difference of 0.16%), Chickasaw (60.4%, a difference of 0.20%), and Alaska Native (60.4%, a difference of 0.20%).
| Demographics | Rating | Rank | College, Under 1 year |
| Trinidadians and Tobagonians | 0.2 /100 | #264 | Tragic 61.1% |
| Immigrants | Bahamas | 0.2 /100 | #265 | Tragic 61.1% |
| Alaskan Athabascans | 0.2 /100 | #266 | Tragic 61.0% |
| Americans | 0.2 /100 | #267 | Tragic 61.0% |
| Immigrants | Trinidad and Tobago | 0.1 /100 | #268 | Tragic 60.7% |
| Immigrants | West Indies | 0.1 /100 | #269 | Tragic 60.6% |
| Cheyenne | 0.1 /100 | #270 | Tragic 60.6% |
| U.S. Virgin Islanders | 0.1 /100 | #271 | Tragic 60.6% |
| Jamaicans | 0.1 /100 | #272 | Tragic 60.5% |
| Chickasaw | 0.1 /100 | #273 | Tragic 60.4% |
| Alaska Natives | 0.1 /100 | #274 | Tragic 60.4% |
| Immigrants | Barbados | 0.1 /100 | #275 | Tragic 60.4% |
| Arapaho | 0.1 /100 | #276 | Tragic 60.3% |
| Bahamians | 0.1 /100 | #277 | Tragic 60.3% |
| Yaqui | 0.1 /100 | #278 | Tragic 60.2% |