Immigrants from Yemen vs Immigrants from El Salvador College, Under 1 year
COMPARE
Immigrants from Yemen
Immigrants from El Salvador
College, Under 1 year
College, Under 1 year Comparison
Immigrants from Yemen
Immigrants from El Salvador
55.3%
COLLEGE, UNDER 1 YEAR
0.0/ 100
METRIC RATING
332nd/ 347
METRIC RANK
56.4%
COLLEGE, UNDER 1 YEAR
0.0/ 100
METRIC RATING
324th/ 347
METRIC RANK
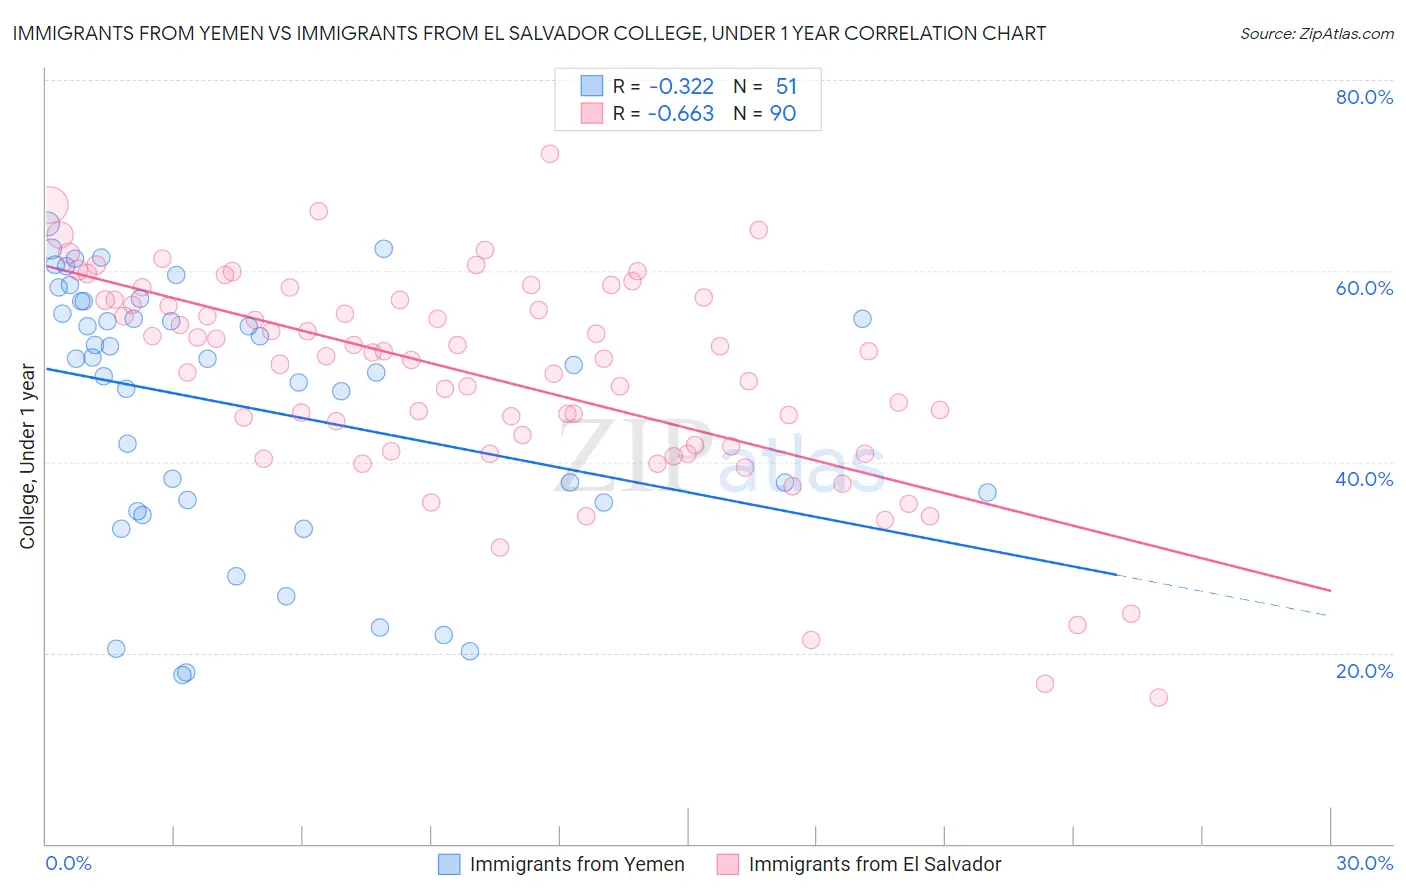
Immigrants from Yemen vs Immigrants from El Salvador College, Under 1 year Correlation Chart
The statistical analysis conducted on geographies consisting of 82,433,611 people shows a mild negative correlation between the proportion of Immigrants from Yemen and percentage of population with at least college, under 1 year education in the United States with a correlation coefficient (R) of -0.322 and weighted average of 55.3%. Similarly, the statistical analysis conducted on geographies consisting of 357,850,135 people shows a significant negative correlation between the proportion of Immigrants from El Salvador and percentage of population with at least college, under 1 year education in the United States with a correlation coefficient (R) of -0.663 and weighted average of 56.4%, a difference of 2.1%.
College, Under 1 year Correlation Summary
| Measurement | Immigrants from Yemen | Immigrants from El Salvador |
| Minimum | 17.6% | 15.3% |
| Maximum | 65.0% | 72.3% |
| Range | 47.3% | 56.9% |
| Mean | 45.9% | 48.9% |
| Median | 50.8% | 51.3% |
| Interquartile 25% (IQ1) | 35.8% | 41.6% |
| Interquartile 75% (IQ3) | 56.8% | 57.0% |
| Interquartile Range (IQR) | 21.0% | 15.4% |
| Standard Deviation (Sample) | 13.6% | 11.1% |
| Standard Deviation (Population) | 13.5% | 11.1% |
Demographics Similar to Immigrants from Yemen and Immigrants from El Salvador by College, Under 1 year
In terms of college, under 1 year, the demographic groups most similar to Immigrants from Yemen are Yuman (55.1%, a difference of 0.32%), Dominican (55.5%, a difference of 0.41%), Mexican (55.6%, a difference of 0.67%), Immigrants from Cuba (55.7%, a difference of 0.80%), and Immigrants from the Azores (54.7%, a difference of 1.1%). Similarly, the demographic groups most similar to Immigrants from El Salvador are Immigrants from Latin America (56.3%, a difference of 0.10%), Immigrants from Honduras (56.5%, a difference of 0.13%), Navajo (56.3%, a difference of 0.25%), Immigrants from Caribbean (56.6%, a difference of 0.31%), and Immigrants from Guatemala (56.2%, a difference of 0.34%).
| Demographics | Rating | Rank | College, Under 1 year |
| Immigrants | Haiti | 0.0 /100 | #318 | Tragic 56.9% |
| Puerto Ricans | 0.0 /100 | #319 | Tragic 56.8% |
| Guatemalans | 0.0 /100 | #320 | Tragic 56.8% |
| Natives/Alaskans | 0.0 /100 | #321 | Tragic 56.6% |
| Immigrants | Caribbean | 0.0 /100 | #322 | Tragic 56.6% |
| Immigrants | Honduras | 0.0 /100 | #323 | Tragic 56.5% |
| Immigrants | El Salvador | 0.0 /100 | #324 | Tragic 56.4% |
| Immigrants | Latin America | 0.0 /100 | #325 | Tragic 56.3% |
| Navajo | 0.0 /100 | #326 | Tragic 56.3% |
| Immigrants | Guatemala | 0.0 /100 | #327 | Tragic 56.2% |
| Cape Verdeans | 0.0 /100 | #328 | Tragic 56.0% |
| Immigrants | Cuba | 0.0 /100 | #329 | Tragic 55.7% |
| Mexicans | 0.0 /100 | #330 | Tragic 55.6% |
| Dominicans | 0.0 /100 | #331 | Tragic 55.5% |
| Immigrants | Yemen | 0.0 /100 | #332 | Tragic 55.3% |
| Yuman | 0.0 /100 | #333 | Tragic 55.1% |
| Immigrants | Azores | 0.0 /100 | #334 | Tragic 54.7% |
| Inupiat | 0.0 /100 | #335 | Tragic 54.6% |
| Pennsylvania Germans | 0.0 /100 | #336 | Tragic 54.5% |
| Immigrants | Central America | 0.0 /100 | #337 | Tragic 54.4% |
| Lumbee | 0.0 /100 | #338 | Tragic 54.2% |