Immigrants from Yemen vs Immigrants from Ethiopia College, Under 1 year
COMPARE
Immigrants from Yemen
Immigrants from Ethiopia
College, Under 1 year
College, Under 1 year Comparison
Immigrants from Yemen
Immigrants from Ethiopia
55.3%
COLLEGE, UNDER 1 YEAR
0.0/ 100
METRIC RATING
332nd/ 347
METRIC RANK
68.0%
COLLEGE, UNDER 1 YEAR
97.3/ 100
METRIC RATING
97th/ 347
METRIC RANK
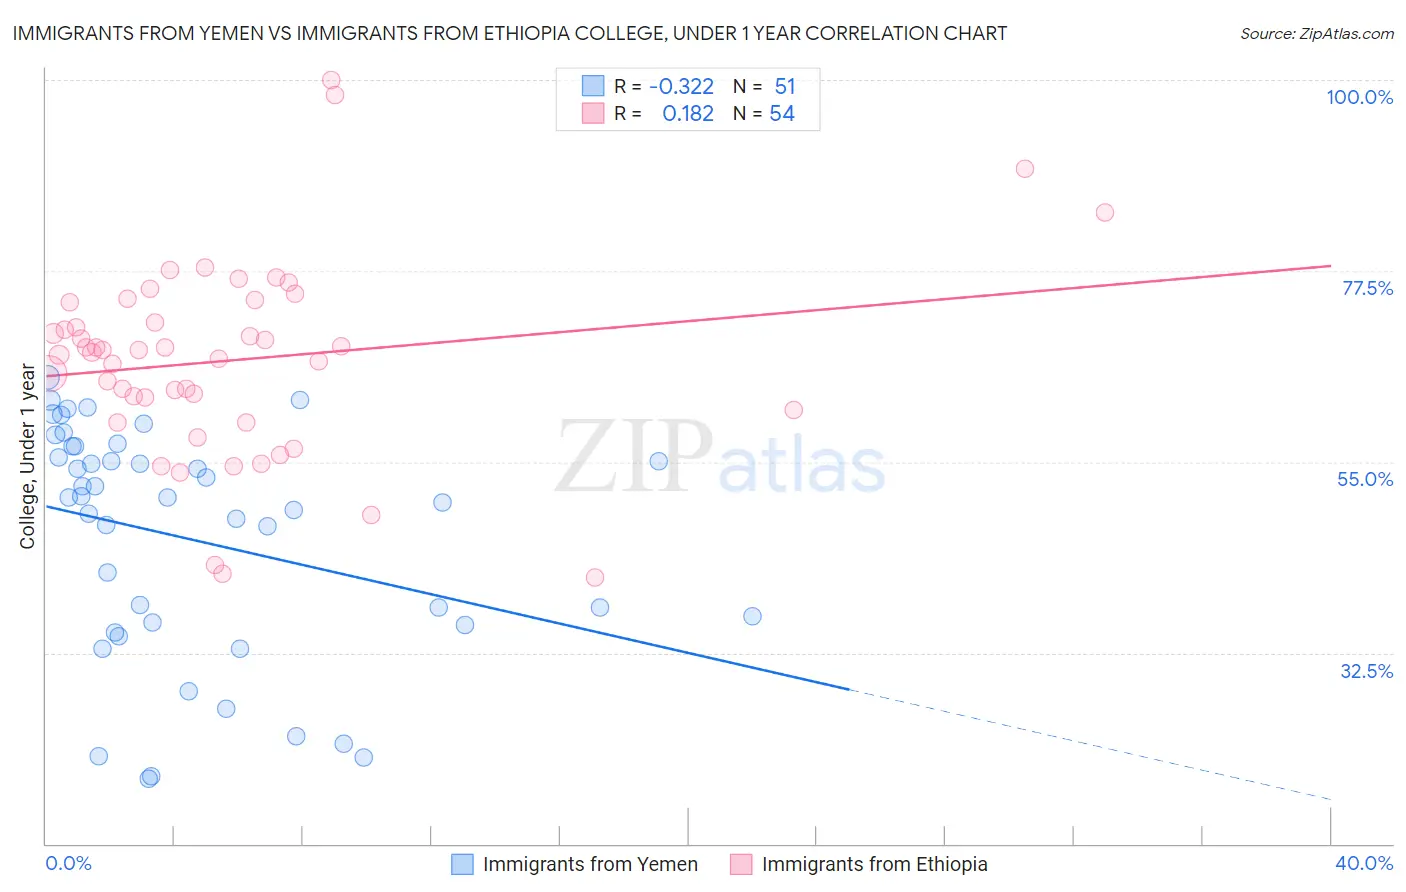
Immigrants from Yemen vs Immigrants from Ethiopia College, Under 1 year Correlation Chart
The statistical analysis conducted on geographies consisting of 82,433,611 people shows a mild negative correlation between the proportion of Immigrants from Yemen and percentage of population with at least college, under 1 year education in the United States with a correlation coefficient (R) of -0.322 and weighted average of 55.3%. Similarly, the statistical analysis conducted on geographies consisting of 211,551,932 people shows a poor positive correlation between the proportion of Immigrants from Ethiopia and percentage of population with at least college, under 1 year education in the United States with a correlation coefficient (R) of 0.182 and weighted average of 68.0%, a difference of 23.1%.
College, Under 1 year Correlation Summary
| Measurement | Immigrants from Yemen | Immigrants from Ethiopia |
| Minimum | 17.6% | 41.4% |
| Maximum | 65.0% | 100.0% |
| Range | 47.3% | 58.6% |
| Mean | 45.9% | 67.0% |
| Median | 50.8% | 68.0% |
| Interquartile 25% (IQ1) | 35.8% | 61.1% |
| Interquartile 75% (IQ3) | 56.8% | 73.8% |
| Interquartile Range (IQR) | 21.0% | 12.6% |
| Standard Deviation (Sample) | 13.6% | 11.6% |
| Standard Deviation (Population) | 13.5% | 11.5% |
Similar Demographics by College, Under 1 year
Demographics Similar to Immigrants from Yemen by College, Under 1 year
In terms of college, under 1 year, the demographic groups most similar to Immigrants from Yemen are Yuman (55.1%, a difference of 0.32%), Dominican (55.5%, a difference of 0.41%), Mexican (55.6%, a difference of 0.67%), Immigrants from Cuba (55.7%, a difference of 0.80%), and Immigrants from the Azores (54.7%, a difference of 1.1%).
| Demographics | Rating | Rank | College, Under 1 year |
| Immigrants | Latin America | 0.0 /100 | #325 | Tragic 56.3% |
| Navajo | 0.0 /100 | #326 | Tragic 56.3% |
| Immigrants | Guatemala | 0.0 /100 | #327 | Tragic 56.2% |
| Cape Verdeans | 0.0 /100 | #328 | Tragic 56.0% |
| Immigrants | Cuba | 0.0 /100 | #329 | Tragic 55.7% |
| Mexicans | 0.0 /100 | #330 | Tragic 55.6% |
| Dominicans | 0.0 /100 | #331 | Tragic 55.5% |
| Immigrants | Yemen | 0.0 /100 | #332 | Tragic 55.3% |
| Yuman | 0.0 /100 | #333 | Tragic 55.1% |
| Immigrants | Azores | 0.0 /100 | #334 | Tragic 54.7% |
| Inupiat | 0.0 /100 | #335 | Tragic 54.6% |
| Pennsylvania Germans | 0.0 /100 | #336 | Tragic 54.5% |
| Immigrants | Central America | 0.0 /100 | #337 | Tragic 54.4% |
| Lumbee | 0.0 /100 | #338 | Tragic 54.2% |
| Immigrants | Dominican Republic | 0.0 /100 | #339 | Tragic 54.0% |
Demographics Similar to Immigrants from Ethiopia by College, Under 1 year
In terms of college, under 1 year, the demographic groups most similar to Immigrants from Ethiopia are Jordanian (68.0%, a difference of 0.030%), Immigrants from Pakistan (68.0%, a difference of 0.060%), Paraguayan (67.9%, a difference of 0.10%), Immigrants from Bolivia (67.9%, a difference of 0.12%), and Immigrants from Argentina (67.9%, a difference of 0.13%).
| Demographics | Rating | Rank | College, Under 1 year |
| Icelanders | 98.1 /100 | #90 | Exceptional 68.3% |
| Europeans | 98.1 /100 | #91 | Exceptional 68.2% |
| Luxembourgers | 98.1 /100 | #92 | Exceptional 68.2% |
| Romanians | 97.9 /100 | #93 | Exceptional 68.2% |
| Armenians | 97.7 /100 | #94 | Exceptional 68.1% |
| Immigrants | Pakistan | 97.5 /100 | #95 | Exceptional 68.0% |
| Jordanians | 97.4 /100 | #96 | Exceptional 68.0% |
| Immigrants | Ethiopia | 97.3 /100 | #97 | Exceptional 68.0% |
| Paraguayans | 97.1 /100 | #98 | Exceptional 67.9% |
| Immigrants | Bolivia | 97.0 /100 | #99 | Exceptional 67.9% |
| Immigrants | Argentina | 97.0 /100 | #100 | Exceptional 67.9% |
| Immigrants | Eastern Europe | 96.9 /100 | #101 | Exceptional 67.9% |
| Palestinians | 96.9 /100 | #102 | Exceptional 67.9% |
| Carpatho Rusyns | 96.8 /100 | #103 | Exceptional 67.9% |
| Immigrants | Western Asia | 96.6 /100 | #104 | Exceptional 67.8% |