Immigrants from Yemen vs Immigrants from Middle Africa College, Under 1 year
COMPARE
Immigrants from Yemen
Immigrants from Middle Africa
College, Under 1 year
College, Under 1 year Comparison
Immigrants from Yemen
Immigrants from Middle Africa
55.3%
COLLEGE, UNDER 1 YEAR
0.0/ 100
METRIC RATING
332nd/ 347
METRIC RANK
63.9%
COLLEGE, UNDER 1 YEAR
10.5/ 100
METRIC RATING
212th/ 347
METRIC RANK
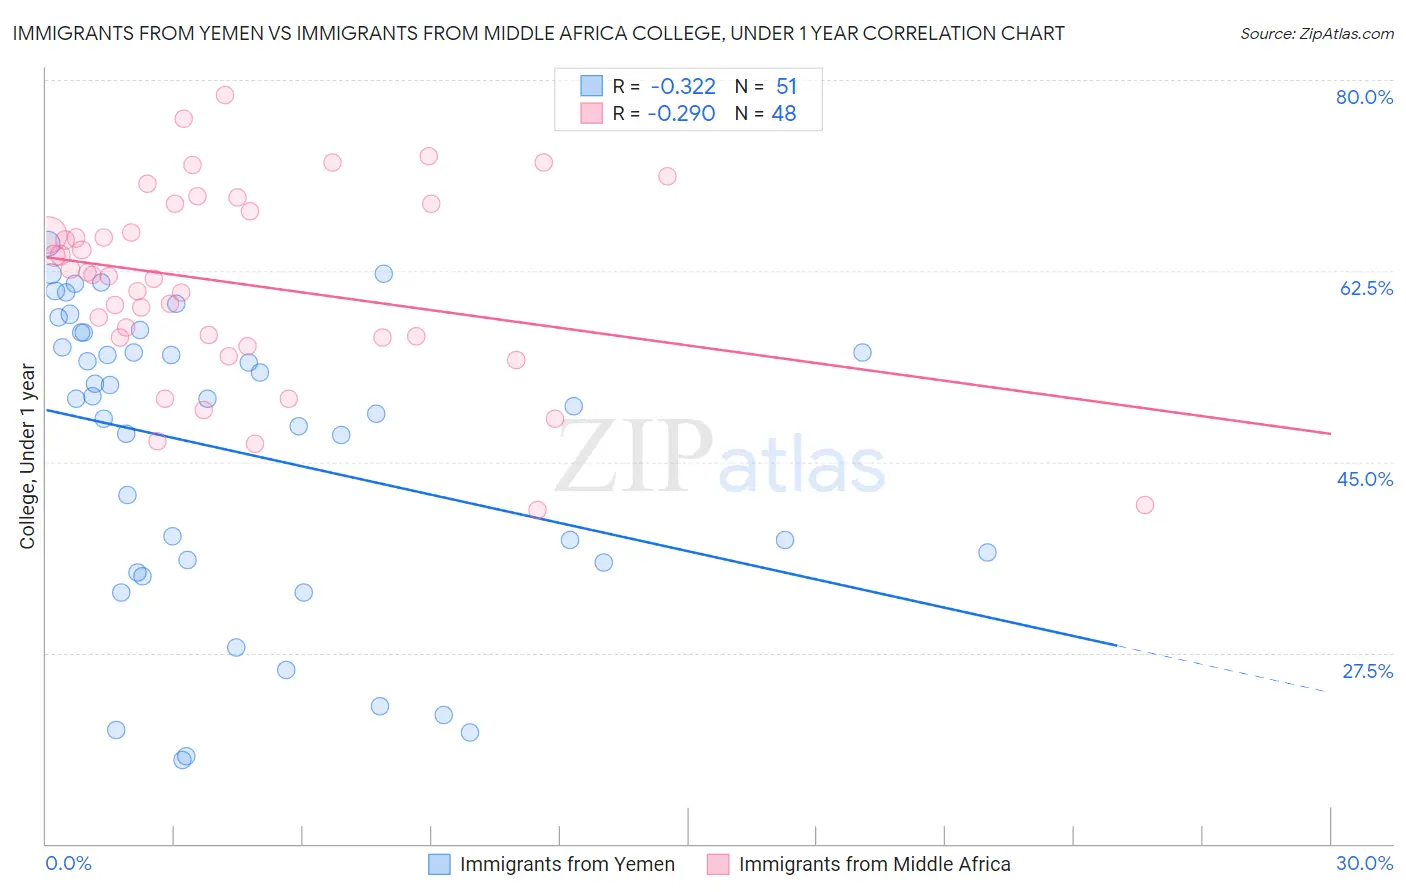
Immigrants from Yemen vs Immigrants from Middle Africa College, Under 1 year Correlation Chart
The statistical analysis conducted on geographies consisting of 82,433,611 people shows a mild negative correlation between the proportion of Immigrants from Yemen and percentage of population with at least college, under 1 year education in the United States with a correlation coefficient (R) of -0.322 and weighted average of 55.3%. Similarly, the statistical analysis conducted on geographies consisting of 202,746,410 people shows a weak negative correlation between the proportion of Immigrants from Middle Africa and percentage of population with at least college, under 1 year education in the United States with a correlation coefficient (R) of -0.290 and weighted average of 63.9%, a difference of 15.6%.
College, Under 1 year Correlation Summary
| Measurement | Immigrants from Yemen | Immigrants from Middle Africa |
| Minimum | 17.6% | 40.6% |
| Maximum | 65.0% | 78.7% |
| Range | 47.3% | 38.1% |
| Mean | 45.9% | 61.3% |
| Median | 50.8% | 62.1% |
| Interquartile 25% (IQ1) | 35.8% | 56.4% |
| Interquartile 75% (IQ3) | 56.8% | 68.4% |
| Interquartile Range (IQR) | 21.0% | 11.9% |
| Standard Deviation (Sample) | 13.6% | 8.8% |
| Standard Deviation (Population) | 13.5% | 8.7% |
Similar Demographics by College, Under 1 year
Demographics Similar to Immigrants from Yemen by College, Under 1 year
In terms of college, under 1 year, the demographic groups most similar to Immigrants from Yemen are Yuman (55.1%, a difference of 0.32%), Dominican (55.5%, a difference of 0.41%), Mexican (55.6%, a difference of 0.67%), Immigrants from Cuba (55.7%, a difference of 0.80%), and Immigrants from the Azores (54.7%, a difference of 1.1%).
| Demographics | Rating | Rank | College, Under 1 year |
| Immigrants | Latin America | 0.0 /100 | #325 | Tragic 56.3% |
| Navajo | 0.0 /100 | #326 | Tragic 56.3% |
| Immigrants | Guatemala | 0.0 /100 | #327 | Tragic 56.2% |
| Cape Verdeans | 0.0 /100 | #328 | Tragic 56.0% |
| Immigrants | Cuba | 0.0 /100 | #329 | Tragic 55.7% |
| Mexicans | 0.0 /100 | #330 | Tragic 55.6% |
| Dominicans | 0.0 /100 | #331 | Tragic 55.5% |
| Immigrants | Yemen | 0.0 /100 | #332 | Tragic 55.3% |
| Yuman | 0.0 /100 | #333 | Tragic 55.1% |
| Immigrants | Azores | 0.0 /100 | #334 | Tragic 54.7% |
| Inupiat | 0.0 /100 | #335 | Tragic 54.6% |
| Pennsylvania Germans | 0.0 /100 | #336 | Tragic 54.5% |
| Immigrants | Central America | 0.0 /100 | #337 | Tragic 54.4% |
| Lumbee | 0.0 /100 | #338 | Tragic 54.2% |
| Immigrants | Dominican Republic | 0.0 /100 | #339 | Tragic 54.0% |
Demographics Similar to Immigrants from Middle Africa by College, Under 1 year
In terms of college, under 1 year, the demographic groups most similar to Immigrants from Middle Africa are Native Hawaiian (63.9%, a difference of 0.010%), Ghanaian (63.9%, a difference of 0.080%), Puget Sound Salish (63.9%, a difference of 0.090%), Immigrants from Vietnam (64.0%, a difference of 0.18%), and Immigrants from South America (63.8%, a difference of 0.18%).
| Demographics | Rating | Rank | College, Under 1 year |
| Peruvians | 13.7 /100 | #205 | Poor 64.1% |
| Whites/Caucasians | 12.8 /100 | #206 | Poor 64.0% |
| Colombians | 12.4 /100 | #207 | Poor 64.0% |
| Immigrants | Vietnam | 12.1 /100 | #208 | Poor 64.0% |
| Puget Sound Salish | 11.3 /100 | #209 | Poor 63.9% |
| Ghanaians | 11.2 /100 | #210 | Poor 63.9% |
| Native Hawaiians | 10.6 /100 | #211 | Poor 63.9% |
| Immigrants | Middle Africa | 10.5 /100 | #212 | Poor 63.9% |
| Immigrants | South America | 9.1 /100 | #213 | Tragic 63.8% |
| Immigrants | Nigeria | 8.8 /100 | #214 | Tragic 63.7% |
| Senegalese | 7.7 /100 | #215 | Tragic 63.6% |
| Hmong | 6.8 /100 | #216 | Tragic 63.5% |
| Immigrants | Uruguay | 5.8 /100 | #217 | Tragic 63.4% |
| Immigrants | Panama | 5.7 /100 | #218 | Tragic 63.4% |
| Immigrants | Fiji | 5.7 /100 | #219 | Tragic 63.4% |