Immigrants from Vietnam vs U.S. Virgin Islander College, Under 1 year
COMPARE
Immigrants from Vietnam
U.S. Virgin Islander
College, Under 1 year
College, Under 1 year Comparison
Immigrants from Vietnam
U.S. Virgin Islanders
64.0%
COLLEGE, UNDER 1 YEAR
12.1/ 100
METRIC RATING
208th/ 347
METRIC RANK
60.6%
COLLEGE, UNDER 1 YEAR
0.1/ 100
METRIC RATING
271st/ 347
METRIC RANK
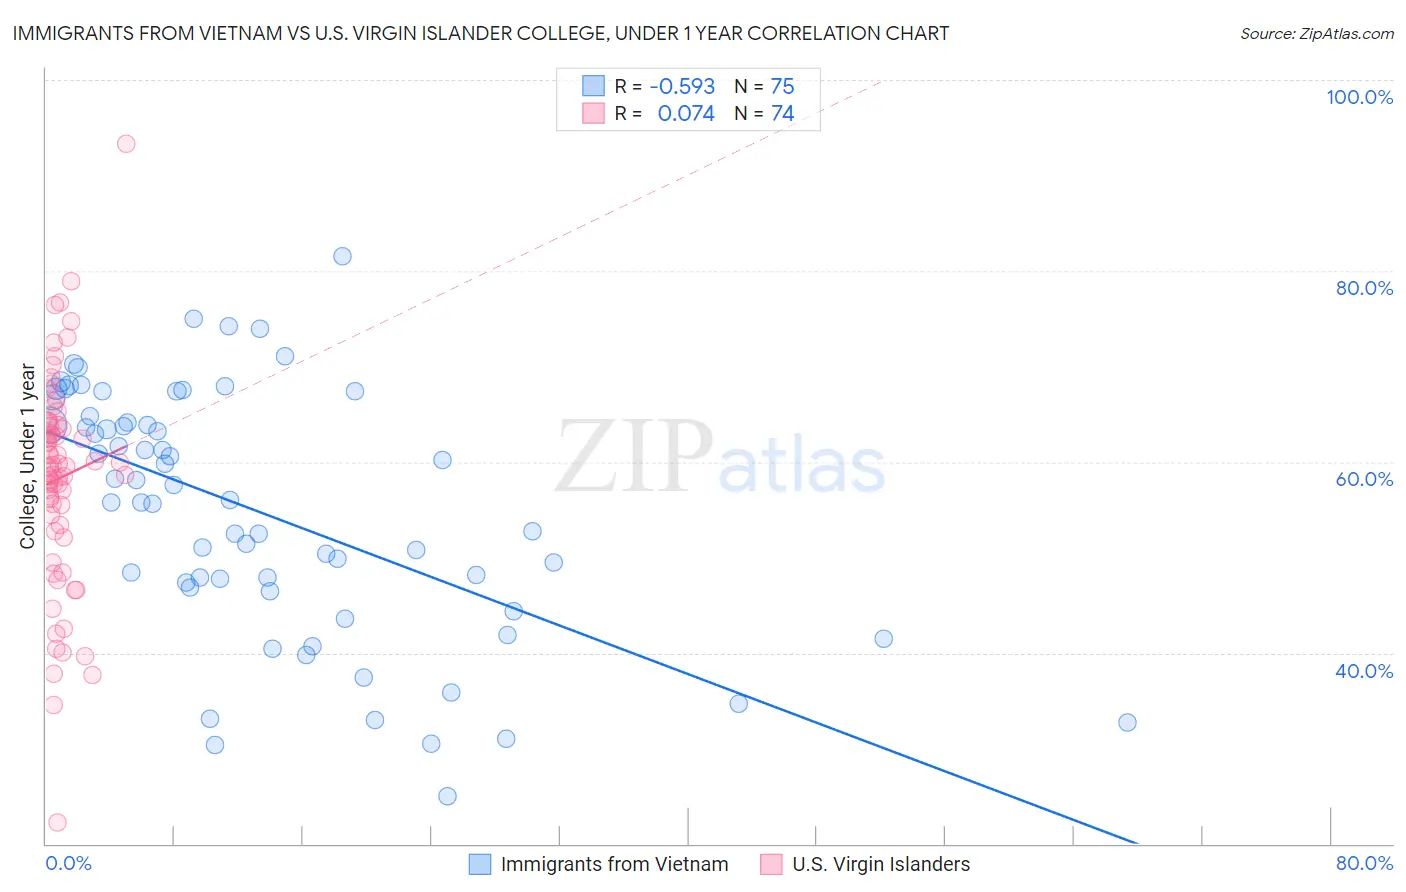
Immigrants from Vietnam vs U.S. Virgin Islander College, Under 1 year Correlation Chart
The statistical analysis conducted on geographies consisting of 404,840,202 people shows a substantial negative correlation between the proportion of Immigrants from Vietnam and percentage of population with at least college, under 1 year education in the United States with a correlation coefficient (R) of -0.593 and weighted average of 64.0%. Similarly, the statistical analysis conducted on geographies consisting of 87,526,675 people shows a slight positive correlation between the proportion of U.S. Virgin Islanders and percentage of population with at least college, under 1 year education in the United States with a correlation coefficient (R) of 0.074 and weighted average of 60.6%, a difference of 5.7%.
College, Under 1 year Correlation Summary
| Measurement | Immigrants from Vietnam | U.S. Virgin Islander |
| Minimum | 25.0% | 22.2% |
| Maximum | 81.5% | 93.4% |
| Range | 56.5% | 71.2% |
| Mean | 54.8% | 58.3% |
| Median | 56.0% | 59.5% |
| Interquartile 25% (IQ1) | 46.8% | 53.4% |
| Interquartile 75% (IQ3) | 64.8% | 63.8% |
| Interquartile Range (IQR) | 17.9% | 10.4% |
| Standard Deviation (Sample) | 12.9% | 11.3% |
| Standard Deviation (Population) | 12.8% | 11.3% |
Similar Demographics by College, Under 1 year
Demographics Similar to Immigrants from Vietnam by College, Under 1 year
In terms of college, under 1 year, the demographic groups most similar to Immigrants from Vietnam are Colombian (64.0%, a difference of 0.030%), White/Caucasian (64.0%, a difference of 0.070%), Puget Sound Salish (63.9%, a difference of 0.090%), Ghanaian (63.9%, a difference of 0.10%), and Peruvian (64.1%, a difference of 0.16%).
| Demographics | Rating | Rank | College, Under 1 year |
| French Canadians | 16.3 /100 | #201 | Poor 64.2% |
| South Americans | 16.2 /100 | #202 | Poor 64.2% |
| Uruguayans | 15.6 /100 | #203 | Poor 64.2% |
| Immigrants | Zaire | 14.6 /100 | #204 | Poor 64.1% |
| Peruvians | 13.7 /100 | #205 | Poor 64.1% |
| Whites/Caucasians | 12.8 /100 | #206 | Poor 64.0% |
| Colombians | 12.4 /100 | #207 | Poor 64.0% |
| Immigrants | Vietnam | 12.1 /100 | #208 | Poor 64.0% |
| Puget Sound Salish | 11.3 /100 | #209 | Poor 63.9% |
| Ghanaians | 11.2 /100 | #210 | Poor 63.9% |
| Native Hawaiians | 10.6 /100 | #211 | Poor 63.9% |
| Immigrants | Middle Africa | 10.5 /100 | #212 | Poor 63.9% |
| Immigrants | South America | 9.1 /100 | #213 | Tragic 63.8% |
| Immigrants | Nigeria | 8.8 /100 | #214 | Tragic 63.7% |
| Senegalese | 7.7 /100 | #215 | Tragic 63.6% |
Demographics Similar to U.S. Virgin Islanders by College, Under 1 year
In terms of college, under 1 year, the demographic groups most similar to U.S. Virgin Islanders are Cheyenne (60.6%, a difference of 0.020%), Immigrants from West Indies (60.6%, a difference of 0.13%), Jamaican (60.5%, a difference of 0.16%), Chickasaw (60.4%, a difference of 0.20%), and Alaska Native (60.4%, a difference of 0.20%).
| Demographics | Rating | Rank | College, Under 1 year |
| Trinidadians and Tobagonians | 0.2 /100 | #264 | Tragic 61.1% |
| Immigrants | Bahamas | 0.2 /100 | #265 | Tragic 61.1% |
| Alaskan Athabascans | 0.2 /100 | #266 | Tragic 61.0% |
| Americans | 0.2 /100 | #267 | Tragic 61.0% |
| Immigrants | Trinidad and Tobago | 0.1 /100 | #268 | Tragic 60.7% |
| Immigrants | West Indies | 0.1 /100 | #269 | Tragic 60.6% |
| Cheyenne | 0.1 /100 | #270 | Tragic 60.6% |
| U.S. Virgin Islanders | 0.1 /100 | #271 | Tragic 60.6% |
| Jamaicans | 0.1 /100 | #272 | Tragic 60.5% |
| Chickasaw | 0.1 /100 | #273 | Tragic 60.4% |
| Alaska Natives | 0.1 /100 | #274 | Tragic 60.4% |
| Immigrants | Barbados | 0.1 /100 | #275 | Tragic 60.4% |
| Arapaho | 0.1 /100 | #276 | Tragic 60.3% |
| Bahamians | 0.1 /100 | #277 | Tragic 60.3% |
| Yaqui | 0.1 /100 | #278 | Tragic 60.2% |