Immigrants from Eastern Africa vs Blackfeet College, Under 1 year
COMPARE
Immigrants from Eastern Africa
Blackfeet
College, Under 1 year
College, Under 1 year Comparison
Immigrants from Eastern Africa
Blackfeet
67.0%
COLLEGE, UNDER 1 YEAR
89.5/ 100
METRIC RATING
129th/ 347
METRIC RANK
61.1%
COLLEGE, UNDER 1 YEAR
0.3/ 100
METRIC RATING
260th/ 347
METRIC RANK
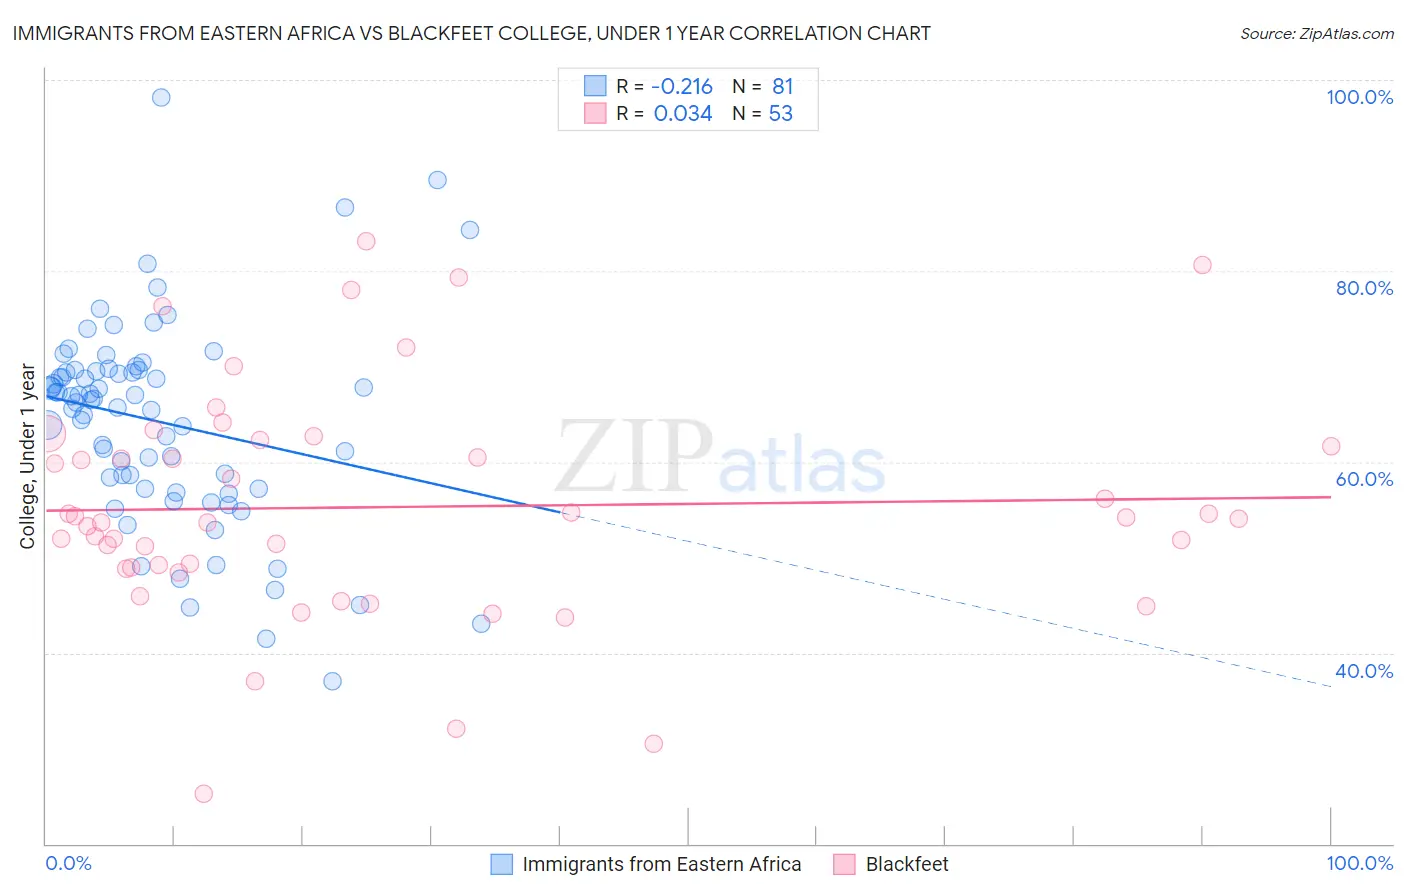
Immigrants from Eastern Africa vs Blackfeet College, Under 1 year Correlation Chart
The statistical analysis conducted on geographies consisting of 355,150,980 people shows a weak negative correlation between the proportion of Immigrants from Eastern Africa and percentage of population with at least college, under 1 year education in the United States with a correlation coefficient (R) of -0.216 and weighted average of 67.0%. Similarly, the statistical analysis conducted on geographies consisting of 309,581,838 people shows no correlation between the proportion of Blackfeet and percentage of population with at least college, under 1 year education in the United States with a correlation coefficient (R) of 0.034 and weighted average of 61.1%, a difference of 9.5%.
College, Under 1 year Correlation Summary
| Measurement | Immigrants from Eastern Africa | Blackfeet |
| Minimum | 37.0% | 25.2% |
| Maximum | 98.2% | 83.1% |
| Range | 61.2% | 57.8% |
| Mean | 64.2% | 55.3% |
| Median | 66.5% | 54.0% |
| Interquartile 25% (IQ1) | 57.2% | 48.9% |
| Interquartile 75% (IQ3) | 69.5% | 62.0% |
| Interquartile Range (IQR) | 12.4% | 13.1% |
| Standard Deviation (Sample) | 10.7% | 12.0% |
| Standard Deviation (Population) | 10.7% | 11.9% |
Similar Demographics by College, Under 1 year
Demographics Similar to Immigrants from Eastern Africa by College, Under 1 year
In terms of college, under 1 year, the demographic groups most similar to Immigrants from Eastern Africa are Immigrants from Syria (66.9%, a difference of 0.060%), Scottish (67.0%, a difference of 0.080%), Finnish (66.9%, a difference of 0.10%), Polish (66.9%, a difference of 0.12%), and Immigrants from Brazil (66.9%, a difference of 0.14%).
| Demographics | Rating | Rank | College, Under 1 year |
| Immigrants | Jordan | 92.8 /100 | #122 | Exceptional 67.3% |
| Immigrants | Northern Africa | 92.7 /100 | #123 | Exceptional 67.2% |
| Arabs | 92.6 /100 | #124 | Exceptional 67.2% |
| Italians | 91.8 /100 | #125 | Exceptional 67.2% |
| Alsatians | 91.3 /100 | #126 | Exceptional 67.1% |
| Czechs | 90.8 /100 | #127 | Exceptional 67.1% |
| Scottish | 90.2 /100 | #128 | Exceptional 67.0% |
| Immigrants | Eastern Africa | 89.5 /100 | #129 | Excellent 67.0% |
| Immigrants | Syria | 89.0 /100 | #130 | Excellent 66.9% |
| Finns | 88.6 /100 | #131 | Excellent 66.9% |
| Poles | 88.4 /100 | #132 | Excellent 66.9% |
| Immigrants | Brazil | 88.3 /100 | #133 | Excellent 66.9% |
| Iraqis | 88.0 /100 | #134 | Excellent 66.8% |
| Canadians | 87.9 /100 | #135 | Excellent 66.8% |
| Ugandans | 87.8 /100 | #136 | Excellent 66.8% |
Demographics Similar to Blackfeet by College, Under 1 year
In terms of college, under 1 year, the demographic groups most similar to Blackfeet are African (61.1%, a difference of 0.030%), Barbadian (61.1%, a difference of 0.070%), Shoshone (61.1%, a difference of 0.070%), Trinidadian and Tobagonian (61.1%, a difference of 0.13%), and Immigrants from Bahamas (61.1%, a difference of 0.13%).
| Demographics | Rating | Rank | College, Under 1 year |
| Japanese | 0.4 /100 | #253 | Tragic 61.5% |
| Immigrants | Cambodia | 0.4 /100 | #254 | Tragic 61.5% |
| Comanche | 0.4 /100 | #255 | Tragic 61.4% |
| Bangladeshis | 0.4 /100 | #256 | Tragic 61.4% |
| Immigrants | Laos | 0.3 /100 | #257 | Tragic 61.3% |
| Immigrants | Bangladesh | 0.3 /100 | #258 | Tragic 61.3% |
| Indonesians | 0.3 /100 | #259 | Tragic 61.2% |
| Blackfeet | 0.3 /100 | #260 | Tragic 61.1% |
| Africans | 0.3 /100 | #261 | Tragic 61.1% |
| Barbadians | 0.2 /100 | #262 | Tragic 61.1% |
| Shoshone | 0.2 /100 | #263 | Tragic 61.1% |
| Trinidadians and Tobagonians | 0.2 /100 | #264 | Tragic 61.1% |
| Immigrants | Bahamas | 0.2 /100 | #265 | Tragic 61.1% |
| Alaskan Athabascans | 0.2 /100 | #266 | Tragic 61.0% |
| Americans | 0.2 /100 | #267 | Tragic 61.0% |