Sudanese vs Blackfeet College, Under 1 year
COMPARE
Sudanese
Blackfeet
College, Under 1 year
College, Under 1 year Comparison
Sudanese
Blackfeet
66.2%
COLLEGE, UNDER 1 YEAR
74.1/ 100
METRIC RATING
152nd/ 347
METRIC RANK
61.1%
COLLEGE, UNDER 1 YEAR
0.3/ 100
METRIC RATING
260th/ 347
METRIC RANK
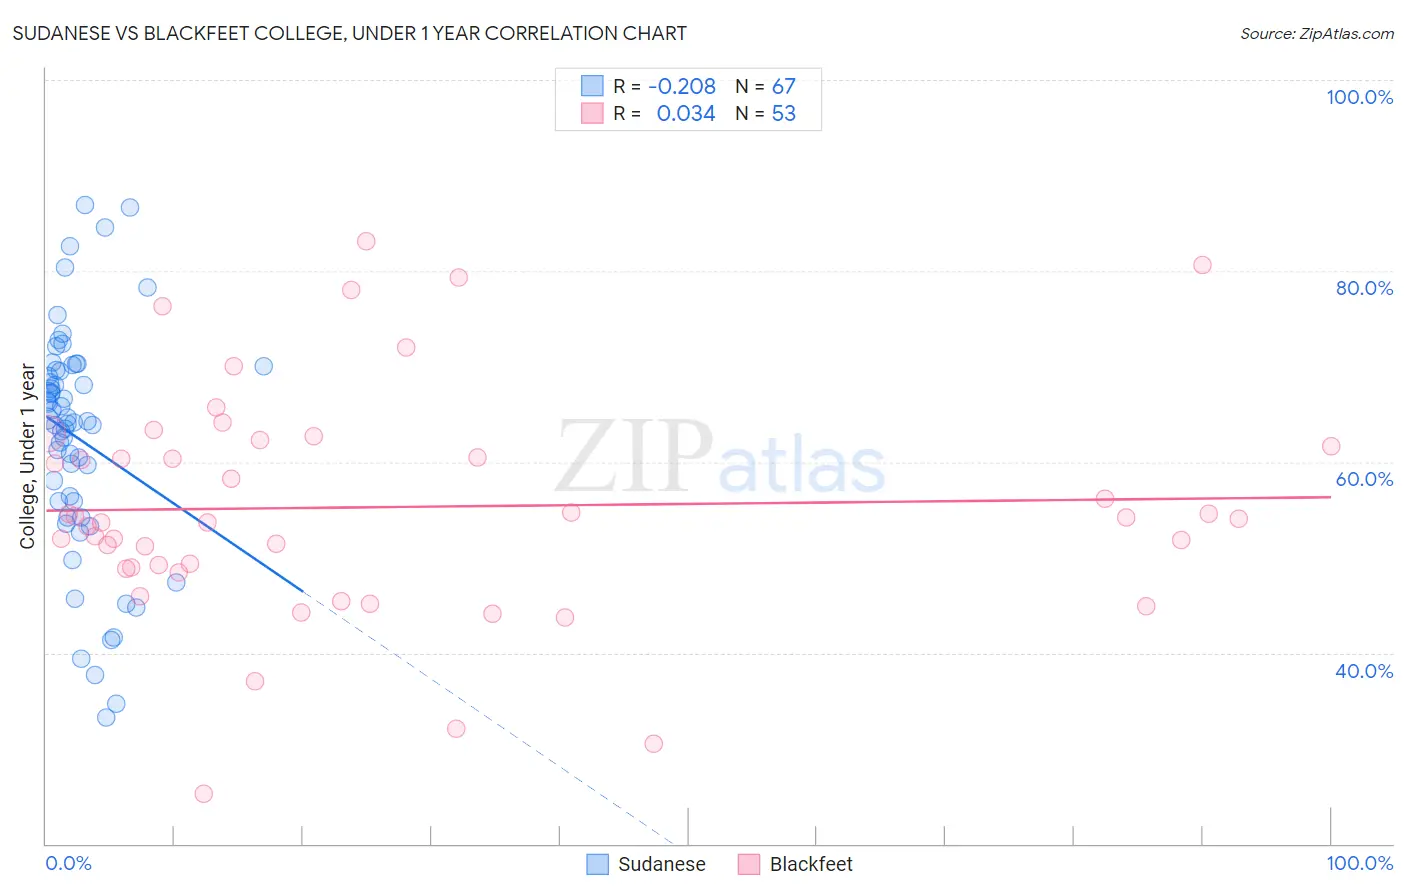
Sudanese vs Blackfeet College, Under 1 year Correlation Chart
The statistical analysis conducted on geographies consisting of 110,147,273 people shows a weak negative correlation between the proportion of Sudanese and percentage of population with at least college, under 1 year education in the United States with a correlation coefficient (R) of -0.208 and weighted average of 66.2%. Similarly, the statistical analysis conducted on geographies consisting of 309,581,838 people shows no correlation between the proportion of Blackfeet and percentage of population with at least college, under 1 year education in the United States with a correlation coefficient (R) of 0.034 and weighted average of 61.1%, a difference of 8.2%.
College, Under 1 year Correlation Summary
| Measurement | Sudanese | Blackfeet |
| Minimum | 33.2% | 25.2% |
| Maximum | 86.9% | 83.1% |
| Range | 53.7% | 57.8% |
| Mean | 62.5% | 55.3% |
| Median | 64.3% | 54.0% |
| Interquartile 25% (IQ1) | 55.9% | 48.9% |
| Interquartile 75% (IQ3) | 69.7% | 62.0% |
| Interquartile Range (IQR) | 13.8% | 13.1% |
| Standard Deviation (Sample) | 12.0% | 12.0% |
| Standard Deviation (Population) | 11.9% | 11.9% |
Similar Demographics by College, Under 1 year
Demographics Similar to Sudanese by College, Under 1 year
In terms of college, under 1 year, the demographic groups most similar to Sudanese are Belgian (66.2%, a difference of 0.020%), Immigrants from Sudan (66.2%, a difference of 0.11%), Immigrants from Eritrea (66.1%, a difference of 0.12%), Immigrants from Iraq (66.3%, a difference of 0.18%), and Irish (66.0%, a difference of 0.21%).
| Demographics | Rating | Rank | College, Under 1 year |
| Immigrants | Kenya | 81.8 /100 | #145 | Excellent 66.5% |
| Kenyans | 81.7 /100 | #146 | Excellent 66.5% |
| Immigrants | Morocco | 81.7 /100 | #147 | Excellent 66.5% |
| Taiwanese | 78.6 /100 | #148 | Good 66.4% |
| Immigrants | Venezuela | 77.9 /100 | #149 | Good 66.3% |
| Immigrants | Iraq | 77.1 /100 | #150 | Good 66.3% |
| Immigrants | Sudan | 76.0 /100 | #151 | Good 66.2% |
| Sudanese | 74.1 /100 | #152 | Good 66.2% |
| Belgians | 73.7 /100 | #153 | Good 66.2% |
| Immigrants | Eritrea | 71.9 /100 | #154 | Good 66.1% |
| Irish | 70.3 /100 | #155 | Good 66.0% |
| Welsh | 69.9 /100 | #156 | Good 66.0% |
| Sierra Leoneans | 67.8 /100 | #157 | Good 66.0% |
| Celtics | 67.3 /100 | #158 | Good 65.9% |
| Tlingit-Haida | 66.4 /100 | #159 | Good 65.9% |
Demographics Similar to Blackfeet by College, Under 1 year
In terms of college, under 1 year, the demographic groups most similar to Blackfeet are African (61.1%, a difference of 0.030%), Barbadian (61.1%, a difference of 0.070%), Shoshone (61.1%, a difference of 0.070%), Trinidadian and Tobagonian (61.1%, a difference of 0.13%), and Immigrants from Bahamas (61.1%, a difference of 0.13%).
| Demographics | Rating | Rank | College, Under 1 year |
| Japanese | 0.4 /100 | #253 | Tragic 61.5% |
| Immigrants | Cambodia | 0.4 /100 | #254 | Tragic 61.5% |
| Comanche | 0.4 /100 | #255 | Tragic 61.4% |
| Bangladeshis | 0.4 /100 | #256 | Tragic 61.4% |
| Immigrants | Laos | 0.3 /100 | #257 | Tragic 61.3% |
| Immigrants | Bangladesh | 0.3 /100 | #258 | Tragic 61.3% |
| Indonesians | 0.3 /100 | #259 | Tragic 61.2% |
| Blackfeet | 0.3 /100 | #260 | Tragic 61.1% |
| Africans | 0.3 /100 | #261 | Tragic 61.1% |
| Barbadians | 0.2 /100 | #262 | Tragic 61.1% |
| Shoshone | 0.2 /100 | #263 | Tragic 61.1% |
| Trinidadians and Tobagonians | 0.2 /100 | #264 | Tragic 61.1% |
| Immigrants | Bahamas | 0.2 /100 | #265 | Tragic 61.1% |
| Alaskan Athabascans | 0.2 /100 | #266 | Tragic 61.0% |
| Americans | 0.2 /100 | #267 | Tragic 61.0% |