Immigrants from Scotland vs Blackfeet College, Under 1 year
COMPARE
Immigrants from Scotland
Blackfeet
College, Under 1 year
College, Under 1 year Comparison
Immigrants from Scotland
Blackfeet
69.4%
COLLEGE, UNDER 1 YEAR
99.6/ 100
METRIC RATING
56th/ 347
METRIC RANK
61.1%
COLLEGE, UNDER 1 YEAR
0.3/ 100
METRIC RATING
260th/ 347
METRIC RANK
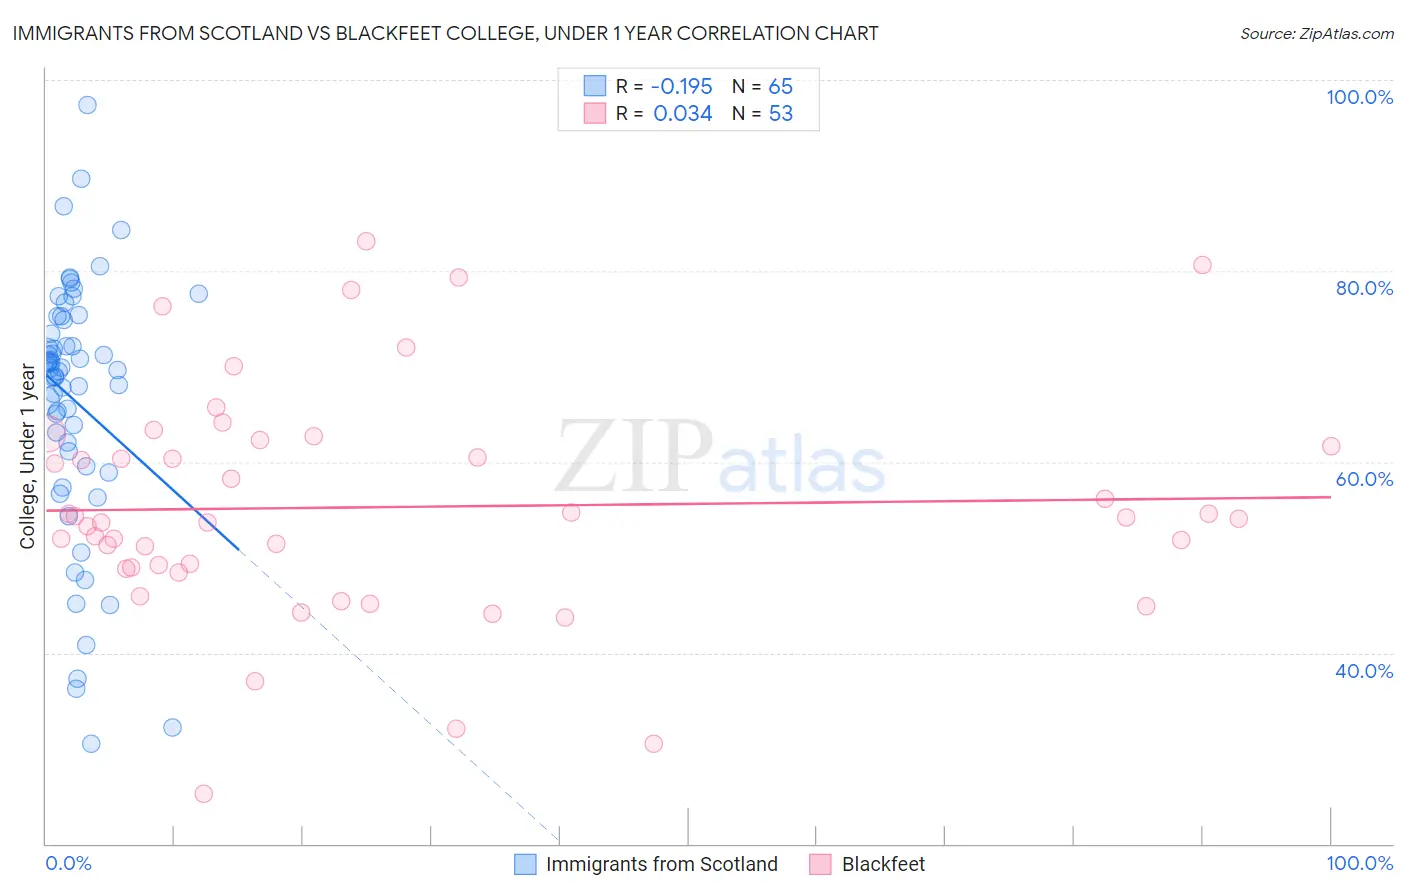
Immigrants from Scotland vs Blackfeet College, Under 1 year Correlation Chart
The statistical analysis conducted on geographies consisting of 196,397,263 people shows a poor negative correlation between the proportion of Immigrants from Scotland and percentage of population with at least college, under 1 year education in the United States with a correlation coefficient (R) of -0.195 and weighted average of 69.4%. Similarly, the statistical analysis conducted on geographies consisting of 309,581,838 people shows no correlation between the proportion of Blackfeet and percentage of population with at least college, under 1 year education in the United States with a correlation coefficient (R) of 0.034 and weighted average of 61.1%, a difference of 13.6%.
College, Under 1 year Correlation Summary
| Measurement | Immigrants from Scotland | Blackfeet |
| Minimum | 30.5% | 25.2% |
| Maximum | 97.4% | 83.1% |
| Range | 66.9% | 57.8% |
| Mean | 66.4% | 55.3% |
| Median | 69.7% | 54.0% |
| Interquartile 25% (IQ1) | 60.3% | 48.9% |
| Interquartile 75% (IQ3) | 75.1% | 62.0% |
| Interquartile Range (IQR) | 14.7% | 13.1% |
| Standard Deviation (Sample) | 13.4% | 12.0% |
| Standard Deviation (Population) | 13.3% | 11.9% |
Similar Demographics by College, Under 1 year
Demographics Similar to Immigrants from Scotland by College, Under 1 year
In terms of college, under 1 year, the demographic groups most similar to Immigrants from Scotland are Asian (69.4%, a difference of 0.020%), Maltese (69.5%, a difference of 0.12%), Immigrants from Malaysia (69.3%, a difference of 0.12%), Immigrants from Czechoslovakia (69.6%, a difference of 0.22%), and Immigrants from Serbia (69.3%, a difference of 0.25%).
| Demographics | Rating | Rank | College, Under 1 year |
| Immigrants | Austria | 99.8 /100 | #49 | Exceptional 70.0% |
| Zimbabweans | 99.8 /100 | #50 | Exceptional 69.9% |
| Mongolians | 99.8 /100 | #51 | Exceptional 69.9% |
| Immigrants | Russia | 99.8 /100 | #52 | Exceptional 69.9% |
| South Africans | 99.7 /100 | #53 | Exceptional 69.7% |
| Immigrants | Czechoslovakia | 99.7 /100 | #54 | Exceptional 69.6% |
| Maltese | 99.7 /100 | #55 | Exceptional 69.5% |
| Immigrants | Scotland | 99.6 /100 | #56 | Exceptional 69.4% |
| Asians | 99.6 /100 | #57 | Exceptional 69.4% |
| Immigrants | Malaysia | 99.6 /100 | #58 | Exceptional 69.3% |
| Immigrants | Serbia | 99.5 /100 | #59 | Exceptional 69.3% |
| Immigrants | Asia | 99.5 /100 | #60 | Exceptional 69.2% |
| Immigrants | Kazakhstan | 99.5 /100 | #61 | Exceptional 69.2% |
| Immigrants | Belarus | 99.5 /100 | #62 | Exceptional 69.2% |
| Immigrants | Canada | 99.4 /100 | #63 | Exceptional 69.1% |
Demographics Similar to Blackfeet by College, Under 1 year
In terms of college, under 1 year, the demographic groups most similar to Blackfeet are African (61.1%, a difference of 0.030%), Barbadian (61.1%, a difference of 0.070%), Shoshone (61.1%, a difference of 0.070%), Trinidadian and Tobagonian (61.1%, a difference of 0.13%), and Immigrants from Bahamas (61.1%, a difference of 0.13%).
| Demographics | Rating | Rank | College, Under 1 year |
| Japanese | 0.4 /100 | #253 | Tragic 61.5% |
| Immigrants | Cambodia | 0.4 /100 | #254 | Tragic 61.5% |
| Comanche | 0.4 /100 | #255 | Tragic 61.4% |
| Bangladeshis | 0.4 /100 | #256 | Tragic 61.4% |
| Immigrants | Laos | 0.3 /100 | #257 | Tragic 61.3% |
| Immigrants | Bangladesh | 0.3 /100 | #258 | Tragic 61.3% |
| Indonesians | 0.3 /100 | #259 | Tragic 61.2% |
| Blackfeet | 0.3 /100 | #260 | Tragic 61.1% |
| Africans | 0.3 /100 | #261 | Tragic 61.1% |
| Barbadians | 0.2 /100 | #262 | Tragic 61.1% |
| Shoshone | 0.2 /100 | #263 | Tragic 61.1% |
| Trinidadians and Tobagonians | 0.2 /100 | #264 | Tragic 61.1% |
| Immigrants | Bahamas | 0.2 /100 | #265 | Tragic 61.1% |
| Alaskan Athabascans | 0.2 /100 | #266 | Tragic 61.0% |
| Americans | 0.2 /100 | #267 | Tragic 61.0% |