Immigrants from Cabo Verde vs Blackfeet College, Under 1 year
COMPARE
Immigrants from Cabo Verde
Blackfeet
College, Under 1 year
College, Under 1 year Comparison
Immigrants from Cabo Verde
Blackfeet
53.7%
COLLEGE, UNDER 1 YEAR
0.0/ 100
METRIC RATING
341st/ 347
METRIC RANK
61.1%
COLLEGE, UNDER 1 YEAR
0.3/ 100
METRIC RATING
260th/ 347
METRIC RANK
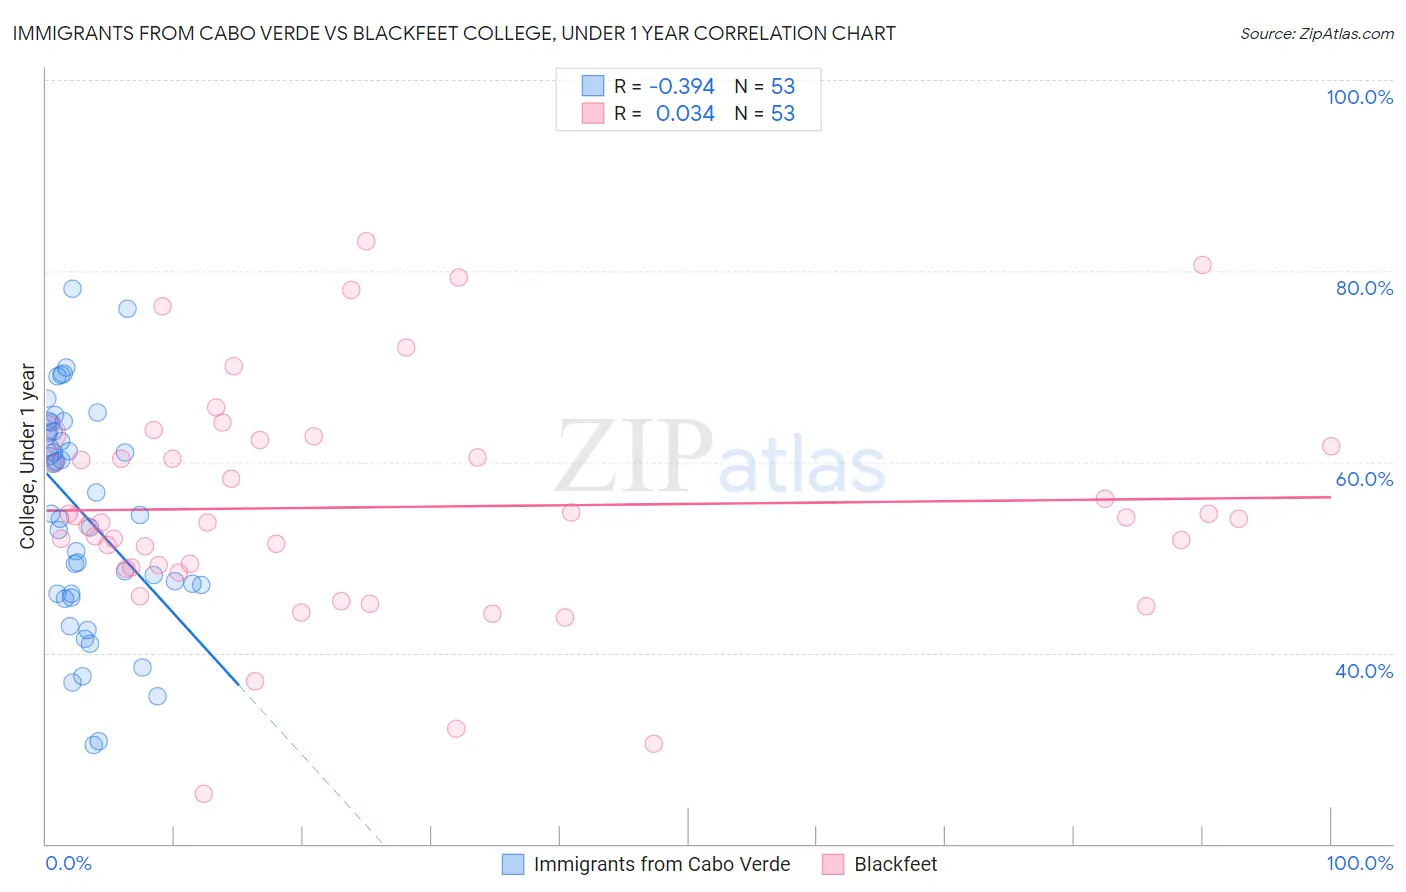
Immigrants from Cabo Verde vs Blackfeet College, Under 1 year Correlation Chart
The statistical analysis conducted on geographies consisting of 38,158,666 people shows a mild negative correlation between the proportion of Immigrants from Cabo Verde and percentage of population with at least college, under 1 year education in the United States with a correlation coefficient (R) of -0.394 and weighted average of 53.7%. Similarly, the statistical analysis conducted on geographies consisting of 309,581,838 people shows no correlation between the proportion of Blackfeet and percentage of population with at least college, under 1 year education in the United States with a correlation coefficient (R) of 0.034 and weighted average of 61.1%, a difference of 13.9%.
College, Under 1 year Correlation Summary
| Measurement | Immigrants from Cabo Verde | Blackfeet |
| Minimum | 30.4% | 25.2% |
| Maximum | 78.2% | 83.1% |
| Range | 47.8% | 57.8% |
| Mean | 54.6% | 55.3% |
| Median | 54.6% | 54.0% |
| Interquartile 25% (IQ1) | 46.2% | 48.9% |
| Interquartile 75% (IQ3) | 63.1% | 62.0% |
| Interquartile Range (IQR) | 16.9% | 13.1% |
| Standard Deviation (Sample) | 11.4% | 12.0% |
| Standard Deviation (Population) | 11.3% | 11.9% |
Similar Demographics by College, Under 1 year
Demographics Similar to Immigrants from Cabo Verde by College, Under 1 year
In terms of college, under 1 year, the demographic groups most similar to Immigrants from Cabo Verde are Immigrants from Mexico (53.7%, a difference of 0.060%), Spanish American Indian (54.0%, a difference of 0.51%), Immigrants from Dominican Republic (54.0%, a difference of 0.59%), Lumbee (54.2%, a difference of 1.0%), and Immigrants from Central America (54.4%, a difference of 1.4%).
| Demographics | Rating | Rank | College, Under 1 year |
| Yuman | 0.0 /100 | #333 | Tragic 55.1% |
| Immigrants | Azores | 0.0 /100 | #334 | Tragic 54.7% |
| Inupiat | 0.0 /100 | #335 | Tragic 54.6% |
| Pennsylvania Germans | 0.0 /100 | #336 | Tragic 54.5% |
| Immigrants | Central America | 0.0 /100 | #337 | Tragic 54.4% |
| Lumbee | 0.0 /100 | #338 | Tragic 54.2% |
| Immigrants | Dominican Republic | 0.0 /100 | #339 | Tragic 54.0% |
| Spanish American Indians | 0.0 /100 | #340 | Tragic 54.0% |
| Immigrants | Cabo Verde | 0.0 /100 | #341 | Tragic 53.7% |
| Immigrants | Mexico | 0.0 /100 | #342 | Tragic 53.7% |
| Tohono O'odham | 0.0 /100 | #343 | Tragic 52.8% |
| Yakama | 0.0 /100 | #344 | Tragic 52.6% |
| Pima | 0.0 /100 | #345 | Tragic 51.4% |
| Houma | 0.0 /100 | #346 | Tragic 47.6% |
| Yup'ik | 0.0 /100 | #347 | Tragic 45.8% |
Demographics Similar to Blackfeet by College, Under 1 year
In terms of college, under 1 year, the demographic groups most similar to Blackfeet are African (61.1%, a difference of 0.030%), Barbadian (61.1%, a difference of 0.070%), Shoshone (61.1%, a difference of 0.070%), Trinidadian and Tobagonian (61.1%, a difference of 0.13%), and Immigrants from Bahamas (61.1%, a difference of 0.13%).
| Demographics | Rating | Rank | College, Under 1 year |
| Japanese | 0.4 /100 | #253 | Tragic 61.5% |
| Immigrants | Cambodia | 0.4 /100 | #254 | Tragic 61.5% |
| Comanche | 0.4 /100 | #255 | Tragic 61.4% |
| Bangladeshis | 0.4 /100 | #256 | Tragic 61.4% |
| Immigrants | Laos | 0.3 /100 | #257 | Tragic 61.3% |
| Immigrants | Bangladesh | 0.3 /100 | #258 | Tragic 61.3% |
| Indonesians | 0.3 /100 | #259 | Tragic 61.2% |
| Blackfeet | 0.3 /100 | #260 | Tragic 61.1% |
| Africans | 0.3 /100 | #261 | Tragic 61.1% |
| Barbadians | 0.2 /100 | #262 | Tragic 61.1% |
| Shoshone | 0.2 /100 | #263 | Tragic 61.1% |
| Trinidadians and Tobagonians | 0.2 /100 | #264 | Tragic 61.1% |
| Immigrants | Bahamas | 0.2 /100 | #265 | Tragic 61.1% |
| Alaskan Athabascans | 0.2 /100 | #266 | Tragic 61.0% |
| Americans | 0.2 /100 | #267 | Tragic 61.0% |