Immigrants from Trinidad and Tobago vs Paiute GED/Equivalency
COMPARE
Immigrants from Trinidad and Tobago
Paiute
GED/Equivalency
GED/Equivalency Comparison
Immigrants from Trinidad and Tobago
Paiute
82.8%
GED/EQUIVALENCY
0.1/ 100
METRIC RATING
274th/ 347
METRIC RANK
82.0%
GED/EQUIVALENCY
0.0/ 100
METRIC RATING
292nd/ 347
METRIC RANK
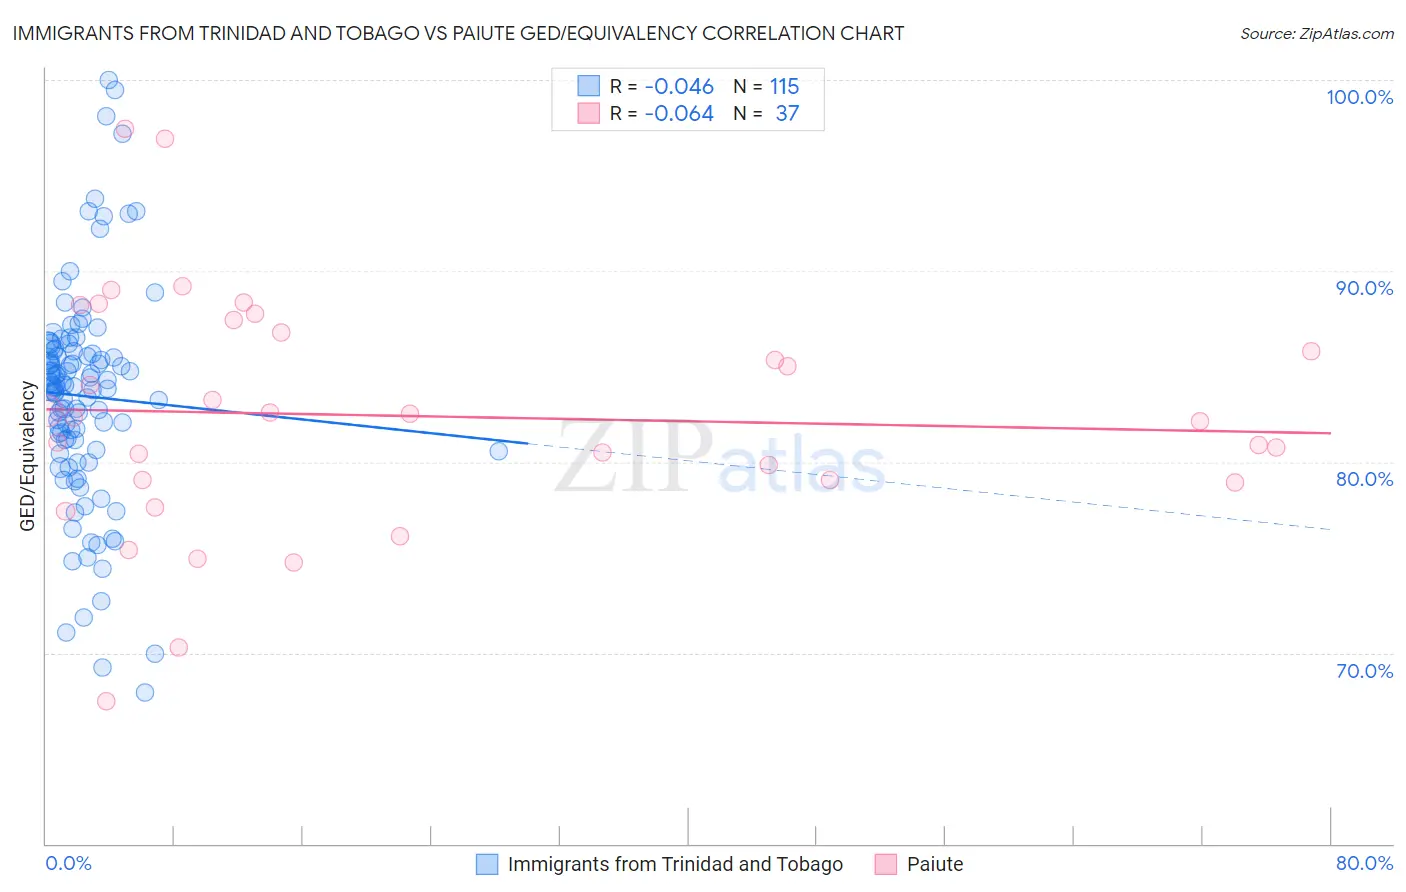
Immigrants from Trinidad and Tobago vs Paiute GED/Equivalency Correlation Chart
The statistical analysis conducted on geographies consisting of 223,527,464 people shows no correlation between the proportion of Immigrants from Trinidad and Tobago and percentage of population with at least ged/equivalency education in the United States with a correlation coefficient (R) of -0.046 and weighted average of 82.8%. Similarly, the statistical analysis conducted on geographies consisting of 58,404,221 people shows a slight negative correlation between the proportion of Paiute and percentage of population with at least ged/equivalency education in the United States with a correlation coefficient (R) of -0.064 and weighted average of 82.0%, a difference of 1.0%.
GED/Equivalency Correlation Summary
| Measurement | Immigrants from Trinidad and Tobago | Paiute |
| Minimum | 67.9% | 67.5% |
| Maximum | 100.0% | 97.4% |
| Range | 32.1% | 29.9% |
| Mean | 83.4% | 82.4% |
| Median | 83.9% | 82.3% |
| Interquartile 25% (IQ1) | 80.6% | 79.0% |
| Interquartile 75% (IQ3) | 85.8% | 87.1% |
| Interquartile Range (IQR) | 5.2% | 8.1% |
| Standard Deviation (Sample) | 5.7% | 6.3% |
| Standard Deviation (Population) | 5.7% | 6.2% |
Demographics Similar to Immigrants from Trinidad and Tobago and Paiute by GED/Equivalency
In terms of ged/equivalency, the demographic groups most similar to Immigrants from Trinidad and Tobago are Pennsylvania German (82.9%, a difference of 0.020%), Seminole (82.8%, a difference of 0.060%), Black/African American (82.8%, a difference of 0.080%), Arapaho (82.8%, a difference of 0.10%), and Immigrants from Laos (82.7%, a difference of 0.13%). Similarly, the demographic groups most similar to Paiute are British West Indian (82.0%, a difference of 0.010%), Cuban (82.0%, a difference of 0.040%), Haitian (82.1%, a difference of 0.060%), Immigrants from Cambodia (82.2%, a difference of 0.25%), and Pueblo (82.3%, a difference of 0.33%).
| Demographics | Rating | Rank | GED/Equivalency |
| Pennsylvania Germans | 0.1 /100 | #273 | Tragic 82.9% |
| Immigrants | Trinidad and Tobago | 0.1 /100 | #274 | Tragic 82.8% |
| Seminole | 0.1 /100 | #275 | Tragic 82.8% |
| Blacks/African Americans | 0.1 /100 | #276 | Tragic 82.8% |
| Arapaho | 0.1 /100 | #277 | Tragic 82.8% |
| Immigrants | Laos | 0.1 /100 | #278 | Tragic 82.7% |
| Immigrants | Fiji | 0.1 /100 | #279 | Tragic 82.7% |
| Cheyenne | 0.1 /100 | #280 | Tragic 82.7% |
| Sioux | 0.1 /100 | #281 | Tragic 82.6% |
| Immigrants | Immigrants | 0.1 /100 | #282 | Tragic 82.6% |
| Indonesians | 0.1 /100 | #283 | Tragic 82.5% |
| Immigrants | Barbados | 0.1 /100 | #284 | Tragic 82.4% |
| Cajuns | 0.0 /100 | #285 | Tragic 82.4% |
| Immigrants | West Indies | 0.0 /100 | #286 | Tragic 82.4% |
| Japanese | 0.0 /100 | #287 | Tragic 82.4% |
| Pueblo | 0.0 /100 | #288 | Tragic 82.3% |
| Immigrants | Cambodia | 0.0 /100 | #289 | Tragic 82.2% |
| Haitians | 0.0 /100 | #290 | Tragic 82.1% |
| Cubans | 0.0 /100 | #291 | Tragic 82.0% |
| Paiute | 0.0 /100 | #292 | Tragic 82.0% |
| British West Indians | 0.0 /100 | #293 | Tragic 82.0% |