Immigrants from Trinidad and Tobago vs South American Indian Householder Income Over 65 years
COMPARE
Immigrants from Trinidad and Tobago
South American Indian
Householder Income Over 65 years
Householder Income Over 65 years Comparison
Immigrants from Trinidad and Tobago
South American Indians
$55,598
HOUSEHOLDER INCOME OVER 65 YEARS
0.4/ 100
METRIC RATING
253rd/ 347
METRIC RANK
$62,215
HOUSEHOLDER INCOME OVER 65 YEARS
78.7/ 100
METRIC RATING
142nd/ 347
METRIC RANK
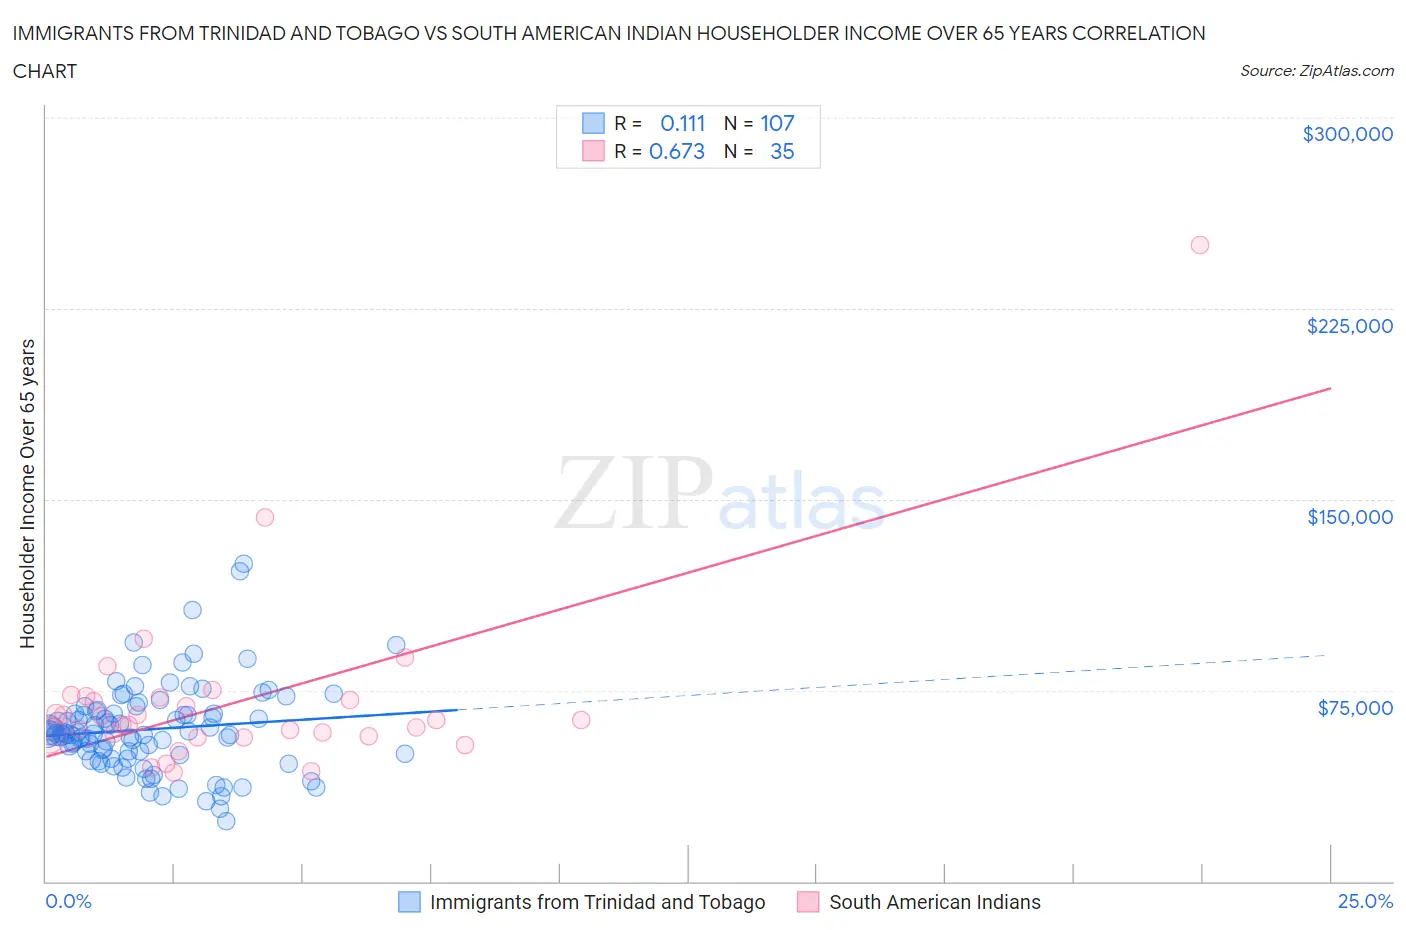
Immigrants from Trinidad and Tobago vs South American Indian Householder Income Over 65 years Correlation Chart
The statistical analysis conducted on geographies consisting of 223,183,074 people shows a poor positive correlation between the proportion of Immigrants from Trinidad and Tobago and household income with householder over the age of 65 in the United States with a correlation coefficient (R) of 0.111 and weighted average of $55,598. Similarly, the statistical analysis conducted on geographies consisting of 164,391,818 people shows a significant positive correlation between the proportion of South American Indians and household income with householder over the age of 65 in the United States with a correlation coefficient (R) of 0.673 and weighted average of $62,215, a difference of 11.9%.
Householder Income Over 65 years Correlation Summary
| Measurement | Immigrants from Trinidad and Tobago | South American Indian |
| Minimum | $23,659 | $42,500 |
| Maximum | $124,816 | $250,001 |
| Range | $101,157 | $207,501 |
| Mean | $59,659 | $70,859 |
| Median | $57,844 | $63,281 |
| Interquartile 25% (IQ1) | $50,192 | $56,818 |
| Interquartile 75% (IQ3) | $65,956 | $72,159 |
| Interquartile Range (IQR) | $15,764 | $15,341 |
| Standard Deviation (Sample) | $17,128 | $35,900 |
| Standard Deviation (Population) | $17,048 | $35,384 |
Similar Demographics by Householder Income Over 65 years
Demographics Similar to Immigrants from Trinidad and Tobago by Householder Income Over 65 years
In terms of householder income over 65 years, the demographic groups most similar to Immigrants from Trinidad and Tobago are American ($55,527, a difference of 0.13%), Osage ($55,677, a difference of 0.14%), Immigrants from Bangladesh ($55,394, a difference of 0.37%), German Russian ($55,356, a difference of 0.44%), and Trinidadian and Tobagonian ($55,327, a difference of 0.49%).
| Demographics | Rating | Rank | Householder Income Over 65 years |
| Central Americans | 0.8 /100 | #246 | Tragic $56,321 |
| Yakama | 0.7 /100 | #247 | Tragic $56,234 |
| Vietnamese | 0.6 /100 | #248 | Tragic $56,143 |
| Mexican American Indians | 0.6 /100 | #249 | Tragic $56,089 |
| Immigrants | Bosnia and Herzegovina | 0.5 /100 | #250 | Tragic $55,986 |
| Immigrants | Portugal | 0.5 /100 | #251 | Tragic $55,924 |
| Osage | 0.4 /100 | #252 | Tragic $55,677 |
| Immigrants | Trinidad and Tobago | 0.4 /100 | #253 | Tragic $55,598 |
| Americans | 0.3 /100 | #254 | Tragic $55,527 |
| Immigrants | Bangladesh | 0.3 /100 | #255 | Tragic $55,394 |
| German Russians | 0.3 /100 | #256 | Tragic $55,356 |
| Trinidadians and Tobagonians | 0.3 /100 | #257 | Tragic $55,327 |
| Ecuadorians | 0.2 /100 | #258 | Tragic $54,958 |
| West Indians | 0.2 /100 | #259 | Tragic $54,936 |
| Immigrants | West Indies | 0.2 /100 | #260 | Tragic $54,927 |
Demographics Similar to South American Indians by Householder Income Over 65 years
In terms of householder income over 65 years, the demographic groups most similar to South American Indians are Canadian ($62,230, a difference of 0.020%), Arab ($62,266, a difference of 0.080%), Immigrants from Belarus ($62,162, a difference of 0.090%), Immigrants from Kazakhstan ($62,292, a difference of 0.12%), and Lebanese ($62,287, a difference of 0.12%).
| Demographics | Rating | Rank | Householder Income Over 65 years |
| Immigrants | Chile | 81.0 /100 | #135 | Excellent $62,354 |
| Alaskan Athabascans | 80.6 /100 | #136 | Excellent $62,330 |
| Immigrants | Syria | 80.2 /100 | #137 | Excellent $62,303 |
| Immigrants | Kazakhstan | 80.0 /100 | #138 | Excellent $62,292 |
| Lebanese | 79.9 /100 | #139 | Good $62,287 |
| Arabs | 79.6 /100 | #140 | Good $62,266 |
| Canadians | 79.0 /100 | #141 | Good $62,230 |
| South American Indians | 78.7 /100 | #142 | Good $62,215 |
| Immigrants | Belarus | 77.8 /100 | #143 | Good $62,162 |
| Immigrants | Peru | 74.4 /100 | #144 | Good $61,988 |
| Immigrants | Uganda | 74.2 /100 | #145 | Good $61,976 |
| Immigrants | Southern Europe | 72.7 /100 | #146 | Good $61,902 |
| Immigrants | Nepal | 71.4 /100 | #147 | Good $61,843 |
| Alsatians | 70.5 /100 | #148 | Good $61,797 |
| Scottish | 69.1 /100 | #149 | Good $61,735 |