Immigrants from Trinidad and Tobago vs Immigrants from Malaysia GED/Equivalency
COMPARE
Immigrants from Trinidad and Tobago
Immigrants from Malaysia
GED/Equivalency
GED/Equivalency Comparison
Immigrants from Trinidad and Tobago
Immigrants from Malaysia
82.8%
GED/EQUIVALENCY
0.1/ 100
METRIC RATING
274th/ 347
METRIC RANK
86.5%
GED/EQUIVALENCY
85.0/ 100
METRIC RATING
139th/ 347
METRIC RANK
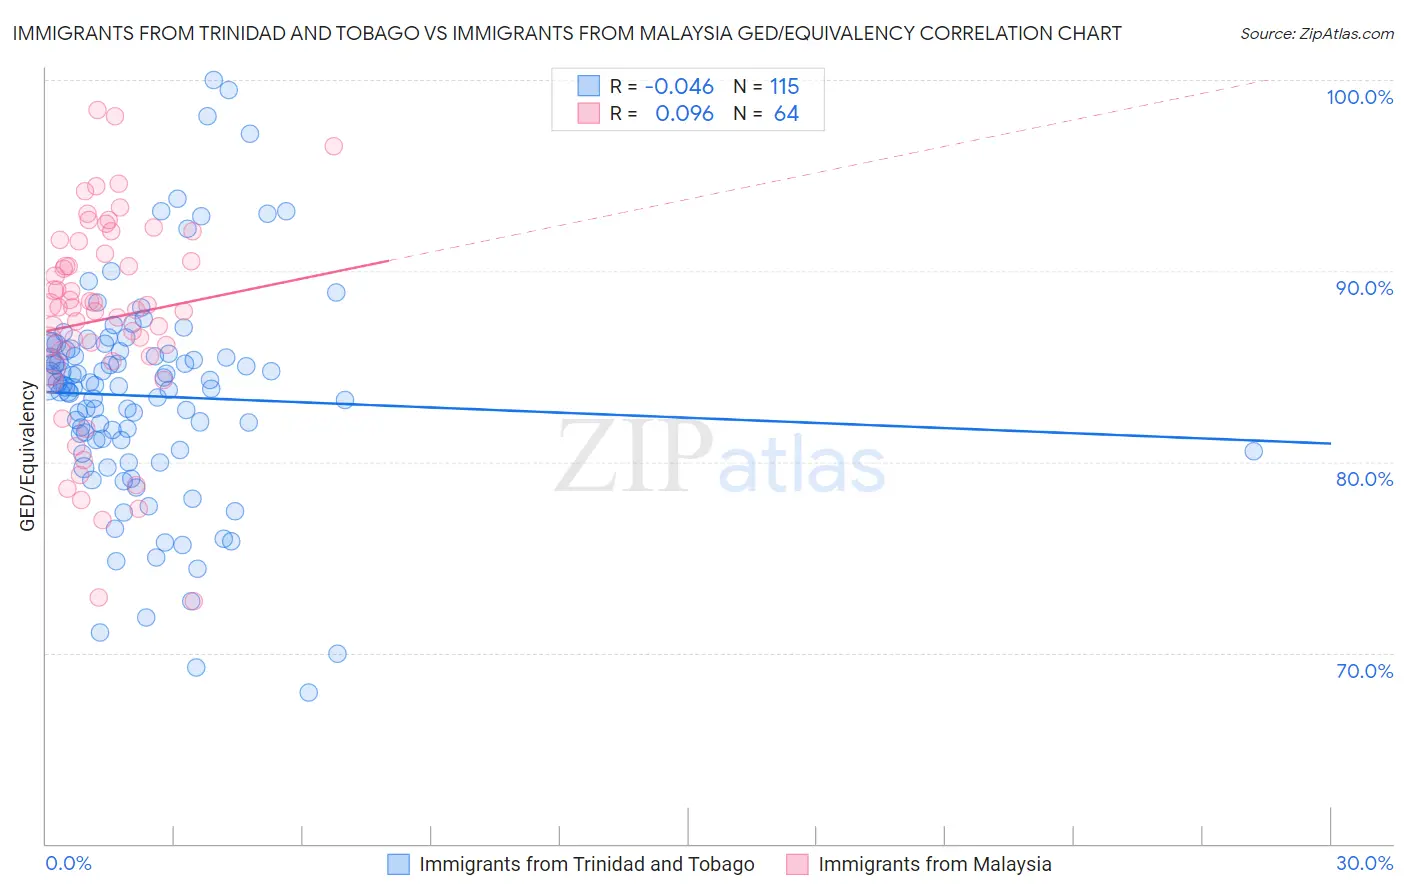
Immigrants from Trinidad and Tobago vs Immigrants from Malaysia GED/Equivalency Correlation Chart
The statistical analysis conducted on geographies consisting of 223,527,464 people shows no correlation between the proportion of Immigrants from Trinidad and Tobago and percentage of population with at least ged/equivalency education in the United States with a correlation coefficient (R) of -0.046 and weighted average of 82.8%. Similarly, the statistical analysis conducted on geographies consisting of 197,973,854 people shows a slight positive correlation between the proportion of Immigrants from Malaysia and percentage of population with at least ged/equivalency education in the United States with a correlation coefficient (R) of 0.096 and weighted average of 86.5%, a difference of 4.4%.
GED/Equivalency Correlation Summary
| Measurement | Immigrants from Trinidad and Tobago | Immigrants from Malaysia |
| Minimum | 67.9% | 72.7% |
| Maximum | 100.0% | 98.4% |
| Range | 32.1% | 25.7% |
| Mean | 83.4% | 87.5% |
| Median | 83.9% | 88.1% |
| Interquartile 25% (IQ1) | 80.6% | 85.4% |
| Interquartile 75% (IQ3) | 85.8% | 91.2% |
| Interquartile Range (IQR) | 5.2% | 5.8% |
| Standard Deviation (Sample) | 5.7% | 5.5% |
| Standard Deviation (Population) | 5.7% | 5.5% |
Similar Demographics by GED/Equivalency
Demographics Similar to Immigrants from Trinidad and Tobago by GED/Equivalency
In terms of ged/equivalency, the demographic groups most similar to Immigrants from Trinidad and Tobago are Barbadian (82.9%, a difference of 0.020%), Pennsylvania German (82.9%, a difference of 0.020%), Seminole (82.8%, a difference of 0.060%), U.S. Virgin Islander (82.9%, a difference of 0.070%), and Black/African American (82.8%, a difference of 0.080%).
| Demographics | Rating | Rank | GED/Equivalency |
| Trinidadians and Tobagonians | 0.2 /100 | #267 | Tragic 83.0% |
| Immigrants | Burma/Myanmar | 0.2 /100 | #268 | Tragic 83.0% |
| Hopi | 0.2 /100 | #269 | Tragic 83.0% |
| Immigrants | Jamaica | 0.2 /100 | #270 | Tragic 82.9% |
| U.S. Virgin Islanders | 0.2 /100 | #271 | Tragic 82.9% |
| Barbadians | 0.1 /100 | #272 | Tragic 82.9% |
| Pennsylvania Germans | 0.1 /100 | #273 | Tragic 82.9% |
| Immigrants | Trinidad and Tobago | 0.1 /100 | #274 | Tragic 82.8% |
| Seminole | 0.1 /100 | #275 | Tragic 82.8% |
| Blacks/African Americans | 0.1 /100 | #276 | Tragic 82.8% |
| Arapaho | 0.1 /100 | #277 | Tragic 82.8% |
| Immigrants | Laos | 0.1 /100 | #278 | Tragic 82.7% |
| Immigrants | Fiji | 0.1 /100 | #279 | Tragic 82.7% |
| Cheyenne | 0.1 /100 | #280 | Tragic 82.7% |
| Sioux | 0.1 /100 | #281 | Tragic 82.6% |
Demographics Similar to Immigrants from Malaysia by GED/Equivalency
In terms of ged/equivalency, the demographic groups most similar to Immigrants from Malaysia are Paraguayan (86.5%, a difference of 0.030%), Immigrants from Argentina (86.6%, a difference of 0.060%), Arab (86.6%, a difference of 0.070%), Laotian (86.5%, a difference of 0.070%), and Chilean (86.6%, a difference of 0.080%).
| Demographics | Rating | Rank | GED/Equivalency |
| Immigrants | Brazil | 88.4 /100 | #132 | Excellent 86.6% |
| Tsimshian | 88.3 /100 | #133 | Excellent 86.6% |
| Albanians | 87.7 /100 | #134 | Excellent 86.6% |
| Immigrants | Asia | 87.4 /100 | #135 | Excellent 86.6% |
| Chileans | 86.9 /100 | #136 | Excellent 86.6% |
| Arabs | 86.7 /100 | #137 | Excellent 86.6% |
| Immigrants | Argentina | 86.5 /100 | #138 | Excellent 86.6% |
| Immigrants | Malaysia | 85.0 /100 | #139 | Excellent 86.5% |
| Paraguayans | 84.1 /100 | #140 | Excellent 86.5% |
| Laotians | 83.2 /100 | #141 | Excellent 86.5% |
| Immigrants | Indonesia | 82.4 /100 | #142 | Excellent 86.4% |
| Immigrants | Pakistan | 82.4 /100 | #143 | Excellent 86.4% |
| Bolivians | 82.1 /100 | #144 | Excellent 86.4% |
| Pakistanis | 80.4 /100 | #145 | Excellent 86.4% |
| Basques | 79.5 /100 | #146 | Good 86.4% |