Immigrants from Trinidad and Tobago vs Immigrants from St. Vincent and the Grenadines GED/Equivalency
COMPARE
Immigrants from Trinidad and Tobago
Immigrants from St. Vincent and the Grenadines
GED/Equivalency
GED/Equivalency Comparison
Immigrants from Trinidad and Tobago
Immigrants from St. Vincent and the Grenadines
82.8%
GED/EQUIVALENCY
0.1/ 100
METRIC RATING
274th/ 347
METRIC RANK
82.0%
GED/EQUIVALENCY
0.0/ 100
METRIC RATING
294th/ 347
METRIC RANK
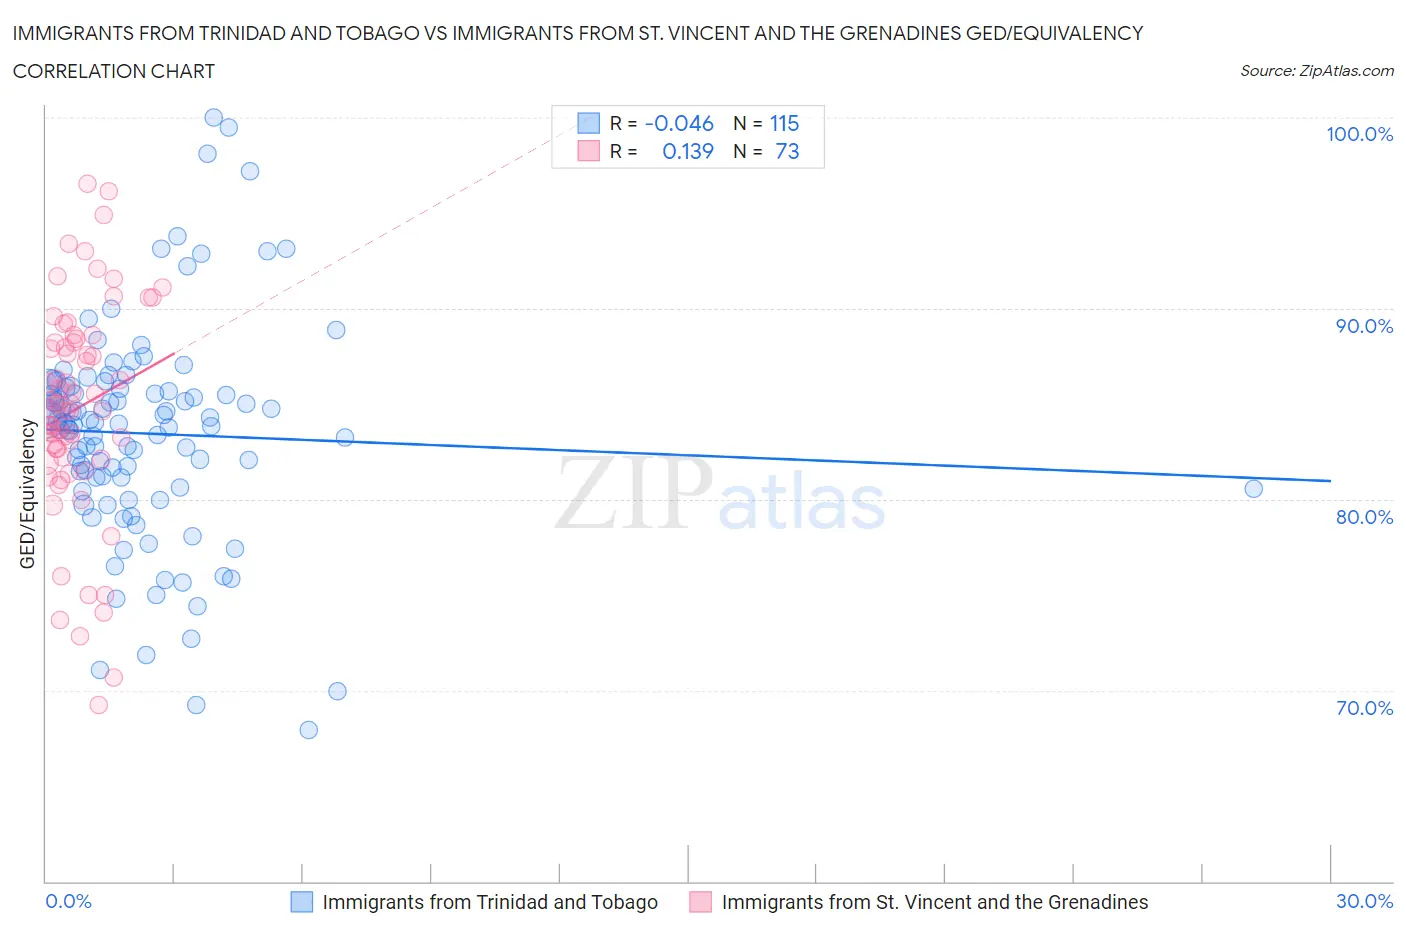
Immigrants from Trinidad and Tobago vs Immigrants from St. Vincent and the Grenadines GED/Equivalency Correlation Chart
The statistical analysis conducted on geographies consisting of 223,527,464 people shows no correlation between the proportion of Immigrants from Trinidad and Tobago and percentage of population with at least ged/equivalency education in the United States with a correlation coefficient (R) of -0.046 and weighted average of 82.8%. Similarly, the statistical analysis conducted on geographies consisting of 56,191,418 people shows a poor positive correlation between the proportion of Immigrants from St. Vincent and the Grenadines and percentage of population with at least ged/equivalency education in the United States with a correlation coefficient (R) of 0.139 and weighted average of 82.0%, a difference of 1.0%.
GED/Equivalency Correlation Summary
| Measurement | Immigrants from Trinidad and Tobago | Immigrants from St. Vincent and the Grenadines |
| Minimum | 67.9% | 69.2% |
| Maximum | 100.0% | 96.6% |
| Range | 32.1% | 27.3% |
| Mean | 83.4% | 84.8% |
| Median | 83.9% | 85.0% |
| Interquartile 25% (IQ1) | 80.6% | 82.1% |
| Interquartile 75% (IQ3) | 85.8% | 88.3% |
| Interquartile Range (IQR) | 5.2% | 6.2% |
| Standard Deviation (Sample) | 5.7% | 5.6% |
| Standard Deviation (Population) | 5.7% | 5.6% |
Demographics Similar to Immigrants from Trinidad and Tobago and Immigrants from St. Vincent and the Grenadines by GED/Equivalency
In terms of ged/equivalency, the demographic groups most similar to Immigrants from Trinidad and Tobago are Seminole (82.8%, a difference of 0.060%), Black/African American (82.8%, a difference of 0.080%), Arapaho (82.8%, a difference of 0.10%), Immigrants from Laos (82.7%, a difference of 0.13%), and Immigrants from Fiji (82.7%, a difference of 0.14%). Similarly, the demographic groups most similar to Immigrants from St. Vincent and the Grenadines are Paiute (82.0%, a difference of 0.030%), British West Indian (82.0%, a difference of 0.030%), Cuban (82.0%, a difference of 0.070%), Haitian (82.1%, a difference of 0.090%), and Immigrants from Cambodia (82.2%, a difference of 0.29%).
| Demographics | Rating | Rank | GED/Equivalency |
| Immigrants | Trinidad and Tobago | 0.1 /100 | #274 | Tragic 82.8% |
| Seminole | 0.1 /100 | #275 | Tragic 82.8% |
| Blacks/African Americans | 0.1 /100 | #276 | Tragic 82.8% |
| Arapaho | 0.1 /100 | #277 | Tragic 82.8% |
| Immigrants | Laos | 0.1 /100 | #278 | Tragic 82.7% |
| Immigrants | Fiji | 0.1 /100 | #279 | Tragic 82.7% |
| Cheyenne | 0.1 /100 | #280 | Tragic 82.7% |
| Sioux | 0.1 /100 | #281 | Tragic 82.6% |
| Immigrants | Immigrants | 0.1 /100 | #282 | Tragic 82.6% |
| Indonesians | 0.1 /100 | #283 | Tragic 82.5% |
| Immigrants | Barbados | 0.1 /100 | #284 | Tragic 82.4% |
| Cajuns | 0.0 /100 | #285 | Tragic 82.4% |
| Immigrants | West Indies | 0.0 /100 | #286 | Tragic 82.4% |
| Japanese | 0.0 /100 | #287 | Tragic 82.4% |
| Pueblo | 0.0 /100 | #288 | Tragic 82.3% |
| Immigrants | Cambodia | 0.0 /100 | #289 | Tragic 82.2% |
| Haitians | 0.0 /100 | #290 | Tragic 82.1% |
| Cubans | 0.0 /100 | #291 | Tragic 82.0% |
| Paiute | 0.0 /100 | #292 | Tragic 82.0% |
| British West Indians | 0.0 /100 | #293 | Tragic 82.0% |
| Immigrants | St. Vincent and the Grenadines | 0.0 /100 | #294 | Tragic 82.0% |