Immigrants from Trinidad and Tobago vs Israeli College, Under 1 year
COMPARE
Immigrants from Trinidad and Tobago
Israeli
College, Under 1 year
College, Under 1 year Comparison
Immigrants from Trinidad and Tobago
Israelis
60.7%
COLLEGE, UNDER 1 YEAR
0.1/ 100
METRIC RATING
268th/ 347
METRIC RANK
70.2%
COLLEGE, UNDER 1 YEAR
99.9/ 100
METRIC RATING
43rd/ 347
METRIC RANK
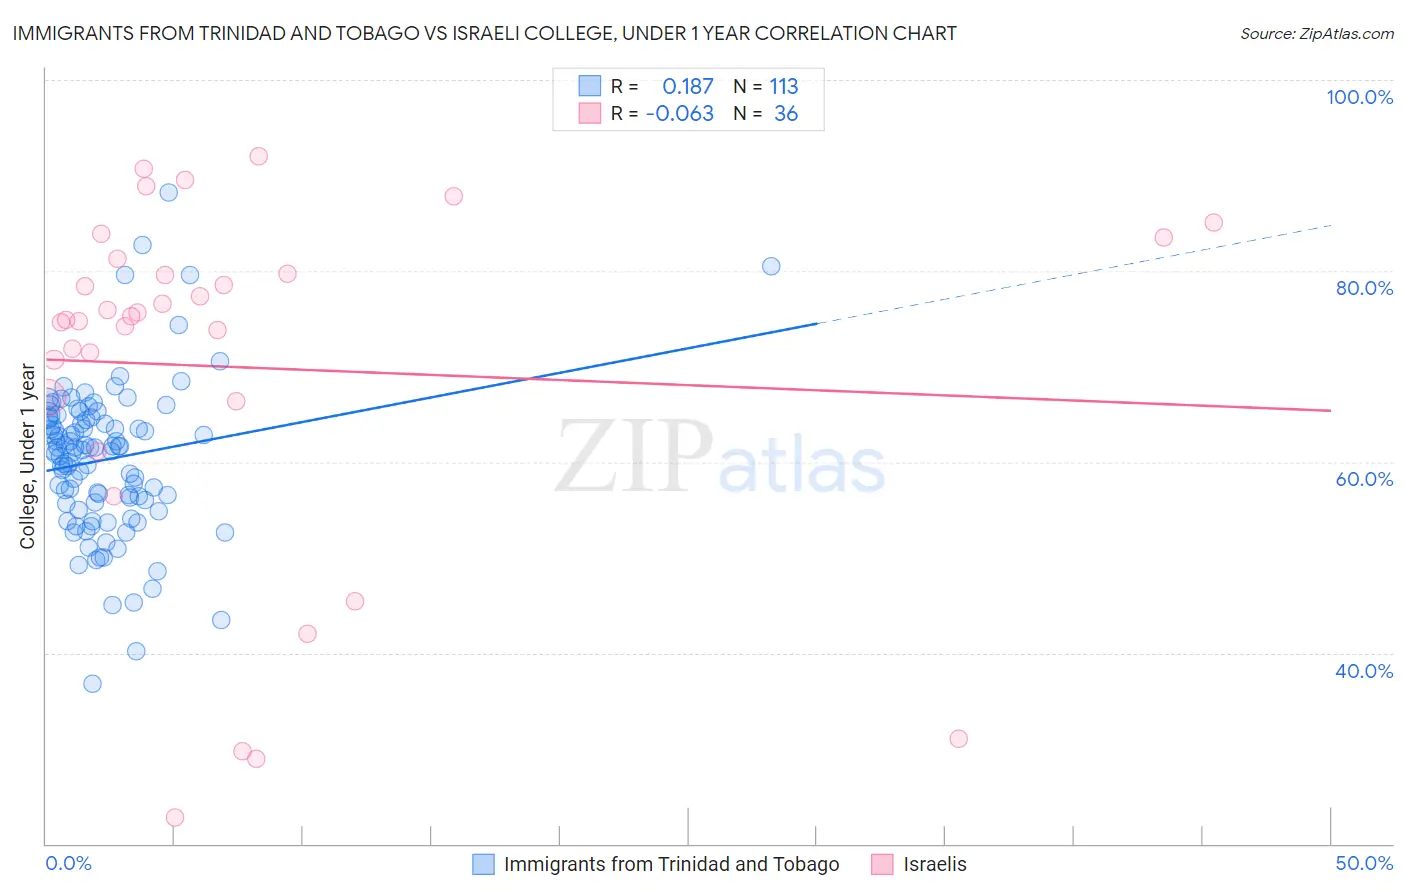
Immigrants from Trinidad and Tobago vs Israeli College, Under 1 year Correlation Chart
The statistical analysis conducted on geographies consisting of 223,526,872 people shows a poor positive correlation between the proportion of Immigrants from Trinidad and Tobago and percentage of population with at least college, under 1 year education in the United States with a correlation coefficient (R) of 0.187 and weighted average of 60.7%. Similarly, the statistical analysis conducted on geographies consisting of 211,218,479 people shows a slight negative correlation between the proportion of Israelis and percentage of population with at least college, under 1 year education in the United States with a correlation coefficient (R) of -0.063 and weighted average of 70.2%, a difference of 15.7%.
College, Under 1 year Correlation Summary
| Measurement | Immigrants from Trinidad and Tobago | Israeli |
| Minimum | 36.7% | 22.7% |
| Maximum | 88.2% | 92.0% |
| Range | 51.4% | 69.3% |
| Mean | 60.3% | 69.9% |
| Median | 61.2% | 75.0% |
| Interquartile 25% (IQ1) | 55.6% | 66.5% |
| Interquartile 75% (IQ3) | 64.6% | 80.5% |
| Interquartile Range (IQR) | 9.0% | 14.0% |
| Standard Deviation (Sample) | 8.0% | 18.6% |
| Standard Deviation (Population) | 8.0% | 18.3% |
Similar Demographics by College, Under 1 year
Demographics Similar to Immigrants from Trinidad and Tobago by College, Under 1 year
In terms of college, under 1 year, the demographic groups most similar to Immigrants from Trinidad and Tobago are Immigrants from West Indies (60.6%, a difference of 0.12%), Cheyenne (60.6%, a difference of 0.23%), U.S. Virgin Islander (60.6%, a difference of 0.24%), Jamaican (60.5%, a difference of 0.40%), and Chickasaw (60.4%, a difference of 0.44%).
| Demographics | Rating | Rank | College, Under 1 year |
| Africans | 0.3 /100 | #261 | Tragic 61.1% |
| Barbadians | 0.2 /100 | #262 | Tragic 61.1% |
| Shoshone | 0.2 /100 | #263 | Tragic 61.1% |
| Trinidadians and Tobagonians | 0.2 /100 | #264 | Tragic 61.1% |
| Immigrants | Bahamas | 0.2 /100 | #265 | Tragic 61.1% |
| Alaskan Athabascans | 0.2 /100 | #266 | Tragic 61.0% |
| Americans | 0.2 /100 | #267 | Tragic 61.0% |
| Immigrants | Trinidad and Tobago | 0.1 /100 | #268 | Tragic 60.7% |
| Immigrants | West Indies | 0.1 /100 | #269 | Tragic 60.6% |
| Cheyenne | 0.1 /100 | #270 | Tragic 60.6% |
| U.S. Virgin Islanders | 0.1 /100 | #271 | Tragic 60.6% |
| Jamaicans | 0.1 /100 | #272 | Tragic 60.5% |
| Chickasaw | 0.1 /100 | #273 | Tragic 60.4% |
| Alaska Natives | 0.1 /100 | #274 | Tragic 60.4% |
| Immigrants | Barbados | 0.1 /100 | #275 | Tragic 60.4% |
Demographics Similar to Israelis by College, Under 1 year
In terms of college, under 1 year, the demographic groups most similar to Israelis are New Zealander (70.2%, a difference of 0.0%), Immigrants from Norway (70.2%, a difference of 0.020%), Immigrants from Lithuania (70.3%, a difference of 0.070%), Immigrants from Kuwait (70.3%, a difference of 0.11%), and Immigrants from Latvia (70.1%, a difference of 0.14%).
| Demographics | Rating | Rank | College, Under 1 year |
| Immigrants | Sri Lanka | 99.9 /100 | #36 | Exceptional 70.5% |
| Immigrants | Saudi Arabia | 99.9 /100 | #37 | Exceptional 70.4% |
| Australians | 99.9 /100 | #38 | Exceptional 70.4% |
| Bhutanese | 99.9 /100 | #39 | Exceptional 70.3% |
| Immigrants | Turkey | 99.9 /100 | #40 | Exceptional 70.3% |
| Immigrants | Kuwait | 99.9 /100 | #41 | Exceptional 70.3% |
| Immigrants | Lithuania | 99.9 /100 | #42 | Exceptional 70.3% |
| Israelis | 99.9 /100 | #43 | Exceptional 70.2% |
| New Zealanders | 99.9 /100 | #44 | Exceptional 70.2% |
| Immigrants | Norway | 99.9 /100 | #45 | Exceptional 70.2% |
| Immigrants | Latvia | 99.9 /100 | #46 | Exceptional 70.1% |
| Immigrants | Bulgaria | 99.8 /100 | #47 | Exceptional 70.0% |
| Immigrants | Netherlands | 99.8 /100 | #48 | Exceptional 70.0% |
| Immigrants | Austria | 99.8 /100 | #49 | Exceptional 70.0% |
| Zimbabweans | 99.8 /100 | #50 | Exceptional 69.9% |