Immigrants from Trinidad and Tobago vs Chinese College, Under 1 year
COMPARE
Immigrants from Trinidad and Tobago
Chinese
College, Under 1 year
College, Under 1 year Comparison
Immigrants from Trinidad and Tobago
Chinese
60.7%
COLLEGE, UNDER 1 YEAR
0.1/ 100
METRIC RATING
268th/ 347
METRIC RANK
68.3%
COLLEGE, UNDER 1 YEAR
98.3/ 100
METRIC RATING
87th/ 347
METRIC RANK
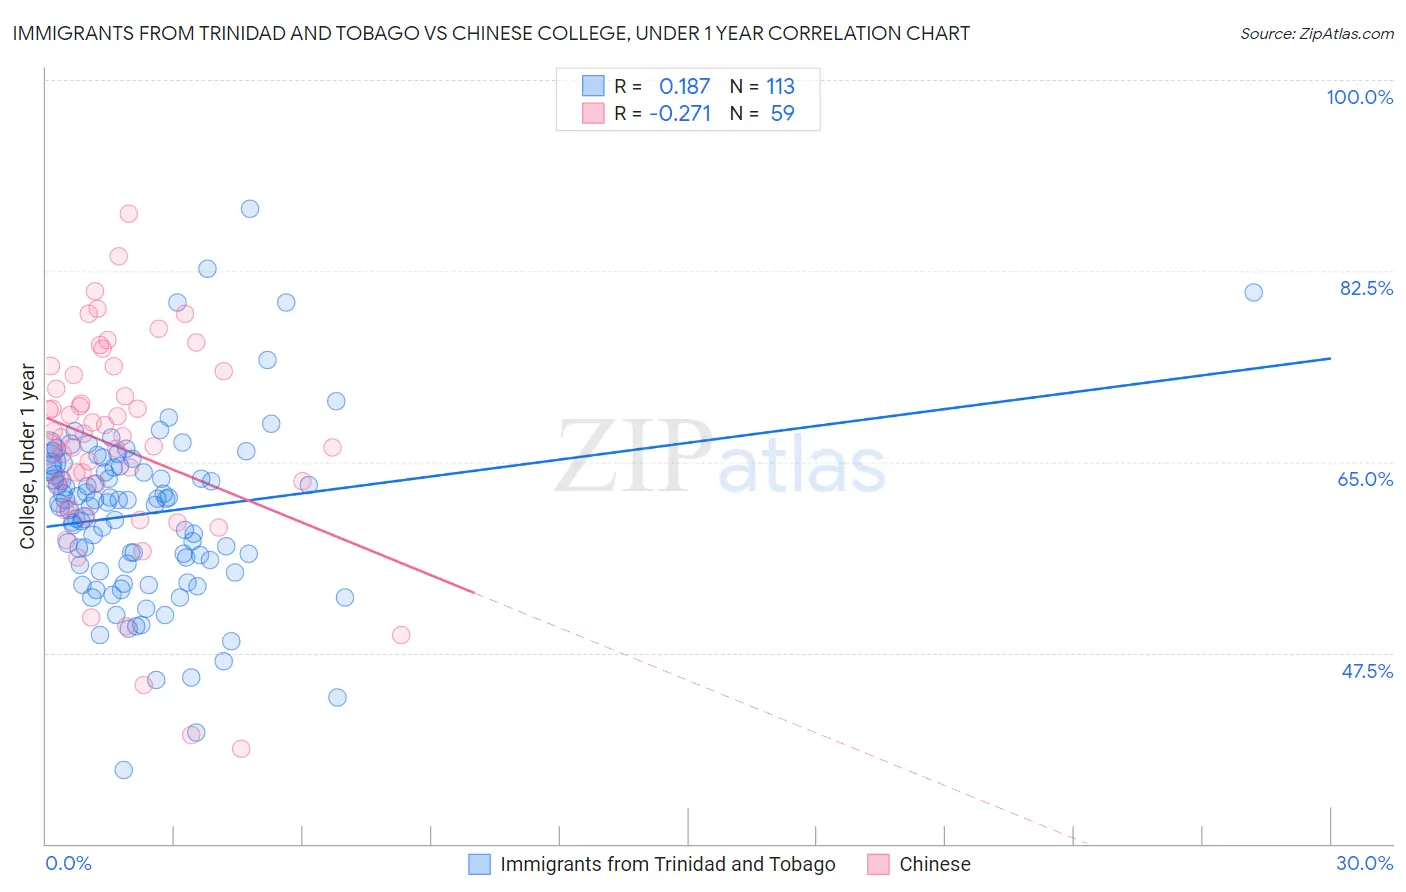
Immigrants from Trinidad and Tobago vs Chinese College, Under 1 year Correlation Chart
The statistical analysis conducted on geographies consisting of 223,526,872 people shows a poor positive correlation between the proportion of Immigrants from Trinidad and Tobago and percentage of population with at least college, under 1 year education in the United States with a correlation coefficient (R) of 0.187 and weighted average of 60.7%. Similarly, the statistical analysis conducted on geographies consisting of 64,809,883 people shows a weak negative correlation between the proportion of Chinese and percentage of population with at least college, under 1 year education in the United States with a correlation coefficient (R) of -0.271 and weighted average of 68.3%, a difference of 12.5%.
College, Under 1 year Correlation Summary
| Measurement | Immigrants from Trinidad and Tobago | Chinese |
| Minimum | 36.7% | 38.7% |
| Maximum | 88.2% | 87.7% |
| Range | 51.4% | 49.1% |
| Mean | 60.3% | 66.3% |
| Median | 61.2% | 67.3% |
| Interquartile 25% (IQ1) | 55.6% | 60.9% |
| Interquartile 75% (IQ3) | 64.6% | 73.0% |
| Interquartile Range (IQR) | 9.0% | 12.1% |
| Standard Deviation (Sample) | 8.0% | 9.8% |
| Standard Deviation (Population) | 8.0% | 9.7% |
Similar Demographics by College, Under 1 year
Demographics Similar to Immigrants from Trinidad and Tobago by College, Under 1 year
In terms of college, under 1 year, the demographic groups most similar to Immigrants from Trinidad and Tobago are Immigrants from West Indies (60.6%, a difference of 0.12%), Cheyenne (60.6%, a difference of 0.23%), U.S. Virgin Islander (60.6%, a difference of 0.24%), Jamaican (60.5%, a difference of 0.40%), and Chickasaw (60.4%, a difference of 0.44%).
| Demographics | Rating | Rank | College, Under 1 year |
| Africans | 0.3 /100 | #261 | Tragic 61.1% |
| Barbadians | 0.2 /100 | #262 | Tragic 61.1% |
| Shoshone | 0.2 /100 | #263 | Tragic 61.1% |
| Trinidadians and Tobagonians | 0.2 /100 | #264 | Tragic 61.1% |
| Immigrants | Bahamas | 0.2 /100 | #265 | Tragic 61.1% |
| Alaskan Athabascans | 0.2 /100 | #266 | Tragic 61.0% |
| Americans | 0.2 /100 | #267 | Tragic 61.0% |
| Immigrants | Trinidad and Tobago | 0.1 /100 | #268 | Tragic 60.7% |
| Immigrants | West Indies | 0.1 /100 | #269 | Tragic 60.6% |
| Cheyenne | 0.1 /100 | #270 | Tragic 60.6% |
| U.S. Virgin Islanders | 0.1 /100 | #271 | Tragic 60.6% |
| Jamaicans | 0.1 /100 | #272 | Tragic 60.5% |
| Chickasaw | 0.1 /100 | #273 | Tragic 60.4% |
| Alaska Natives | 0.1 /100 | #274 | Tragic 60.4% |
| Immigrants | Barbados | 0.1 /100 | #275 | Tragic 60.4% |
Demographics Similar to Chinese by College, Under 1 year
In terms of college, under 1 year, the demographic groups most similar to Chinese are Immigrants from Lebanon (68.3%, a difference of 0.020%), Croatian (68.3%, a difference of 0.020%), Immigrants from Hungary (68.3%, a difference of 0.030%), Egyptian (68.3%, a difference of 0.030%), and Ethiopian (68.3%, a difference of 0.030%).
| Demographics | Rating | Rank | College, Under 1 year |
| Immigrants | Spain | 98.5 /100 | #80 | Exceptional 68.4% |
| Immigrants | Greece | 98.5 /100 | #81 | Exceptional 68.4% |
| Norwegians | 98.4 /100 | #82 | Exceptional 68.4% |
| Argentineans | 98.4 /100 | #83 | Exceptional 68.4% |
| Immigrants | Hungary | 98.3 /100 | #84 | Exceptional 68.3% |
| Egyptians | 98.3 /100 | #85 | Exceptional 68.3% |
| Immigrants | Lebanon | 98.3 /100 | #86 | Exceptional 68.3% |
| Chinese | 98.3 /100 | #87 | Exceptional 68.3% |
| Croatians | 98.2 /100 | #88 | Exceptional 68.3% |
| Ethiopians | 98.2 /100 | #89 | Exceptional 68.3% |
| Icelanders | 98.1 /100 | #90 | Exceptional 68.3% |
| Europeans | 98.1 /100 | #91 | Exceptional 68.2% |
| Luxembourgers | 98.1 /100 | #92 | Exceptional 68.2% |
| Romanians | 97.9 /100 | #93 | Exceptional 68.2% |
| Armenians | 97.7 /100 | #94 | Exceptional 68.1% |