Immigrants from Trinidad and Tobago vs Irish College, Under 1 year
COMPARE
Immigrants from Trinidad and Tobago
Irish
College, Under 1 year
College, Under 1 year Comparison
Immigrants from Trinidad and Tobago
Irish
60.7%
COLLEGE, UNDER 1 YEAR
0.1/ 100
METRIC RATING
268th/ 347
METRIC RANK
66.0%
COLLEGE, UNDER 1 YEAR
70.3/ 100
METRIC RATING
155th/ 347
METRIC RANK
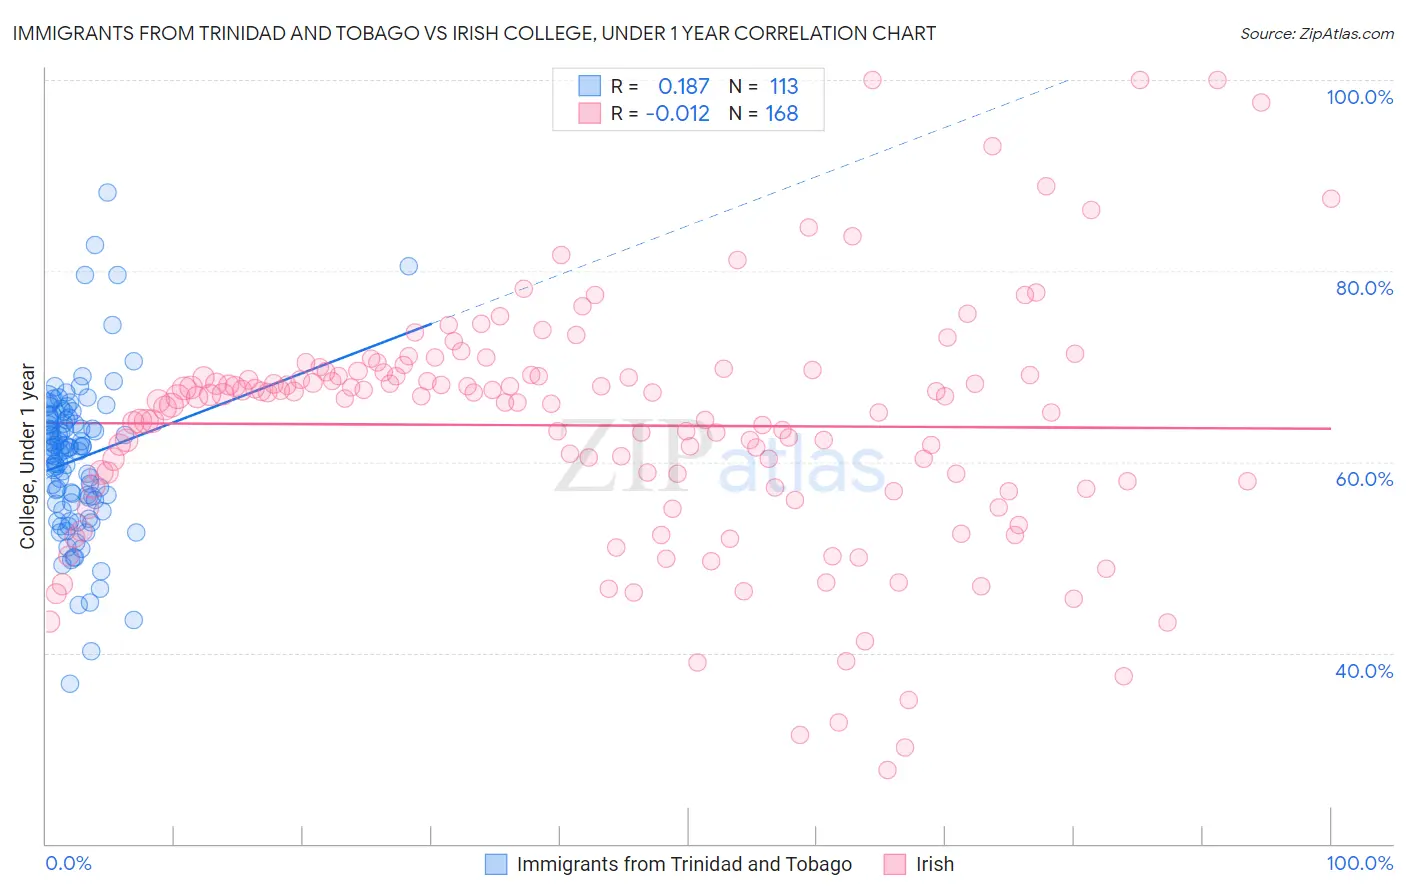
Immigrants from Trinidad and Tobago vs Irish College, Under 1 year Correlation Chart
The statistical analysis conducted on geographies consisting of 223,526,872 people shows a poor positive correlation between the proportion of Immigrants from Trinidad and Tobago and percentage of population with at least college, under 1 year education in the United States with a correlation coefficient (R) of 0.187 and weighted average of 60.7%. Similarly, the statistical analysis conducted on geographies consisting of 580,693,587 people shows no correlation between the proportion of Irish and percentage of population with at least college, under 1 year education in the United States with a correlation coefficient (R) of -0.012 and weighted average of 66.0%, a difference of 8.8%.
College, Under 1 year Correlation Summary
| Measurement | Immigrants from Trinidad and Tobago | Irish |
| Minimum | 36.7% | 27.7% |
| Maximum | 88.2% | 100.0% |
| Range | 51.4% | 72.3% |
| Mean | 60.3% | 63.8% |
| Median | 61.2% | 66.7% |
| Interquartile 25% (IQ1) | 55.6% | 57.4% |
| Interquartile 75% (IQ3) | 64.6% | 69.1% |
| Interquartile Range (IQR) | 9.0% | 11.7% |
| Standard Deviation (Sample) | 8.0% | 12.6% |
| Standard Deviation (Population) | 8.0% | 12.6% |
Similar Demographics by College, Under 1 year
Demographics Similar to Immigrants from Trinidad and Tobago by College, Under 1 year
In terms of college, under 1 year, the demographic groups most similar to Immigrants from Trinidad and Tobago are Immigrants from West Indies (60.6%, a difference of 0.12%), Cheyenne (60.6%, a difference of 0.23%), U.S. Virgin Islander (60.6%, a difference of 0.24%), Jamaican (60.5%, a difference of 0.40%), and Chickasaw (60.4%, a difference of 0.44%).
| Demographics | Rating | Rank | College, Under 1 year |
| Africans | 0.3 /100 | #261 | Tragic 61.1% |
| Barbadians | 0.2 /100 | #262 | Tragic 61.1% |
| Shoshone | 0.2 /100 | #263 | Tragic 61.1% |
| Trinidadians and Tobagonians | 0.2 /100 | #264 | Tragic 61.1% |
| Immigrants | Bahamas | 0.2 /100 | #265 | Tragic 61.1% |
| Alaskan Athabascans | 0.2 /100 | #266 | Tragic 61.0% |
| Americans | 0.2 /100 | #267 | Tragic 61.0% |
| Immigrants | Trinidad and Tobago | 0.1 /100 | #268 | Tragic 60.7% |
| Immigrants | West Indies | 0.1 /100 | #269 | Tragic 60.6% |
| Cheyenne | 0.1 /100 | #270 | Tragic 60.6% |
| U.S. Virgin Islanders | 0.1 /100 | #271 | Tragic 60.6% |
| Jamaicans | 0.1 /100 | #272 | Tragic 60.5% |
| Chickasaw | 0.1 /100 | #273 | Tragic 60.4% |
| Alaska Natives | 0.1 /100 | #274 | Tragic 60.4% |
| Immigrants | Barbados | 0.1 /100 | #275 | Tragic 60.4% |
Demographics Similar to Irish by College, Under 1 year
In terms of college, under 1 year, the demographic groups most similar to Irish are Welsh (66.0%, a difference of 0.020%), Immigrants from Eritrea (66.1%, a difference of 0.090%), Sierra Leonean (66.0%, a difference of 0.12%), Celtic (65.9%, a difference of 0.15%), and Belgian (66.2%, a difference of 0.18%).
| Demographics | Rating | Rank | College, Under 1 year |
| Taiwanese | 78.6 /100 | #148 | Good 66.4% |
| Immigrants | Venezuela | 77.9 /100 | #149 | Good 66.3% |
| Immigrants | Iraq | 77.1 /100 | #150 | Good 66.3% |
| Immigrants | Sudan | 76.0 /100 | #151 | Good 66.2% |
| Sudanese | 74.1 /100 | #152 | Good 66.2% |
| Belgians | 73.7 /100 | #153 | Good 66.2% |
| Immigrants | Eritrea | 71.9 /100 | #154 | Good 66.1% |
| Irish | 70.3 /100 | #155 | Good 66.0% |
| Welsh | 69.9 /100 | #156 | Good 66.0% |
| Sierra Leoneans | 67.8 /100 | #157 | Good 66.0% |
| Celtics | 67.3 /100 | #158 | Good 65.9% |
| Tlingit-Haida | 66.4 /100 | #159 | Good 65.9% |
| Albanians | 66.1 /100 | #160 | Good 65.9% |
| Brazilians | 66.0 /100 | #161 | Good 65.9% |
| Koreans | 65.3 /100 | #162 | Good 65.9% |