Immigrants from Taiwan vs Latvian College, Under 1 year
COMPARE
Immigrants from Taiwan
Latvian
College, Under 1 year
College, Under 1 year Comparison
Immigrants from Taiwan
Latvians
74.2%
COLLEGE, UNDER 1 YEAR
100.0/ 100
METRIC RATING
6th/ 347
METRIC RANK
71.6%
COLLEGE, UNDER 1 YEAR
100.0/ 100
METRIC RATING
19th/ 347
METRIC RANK
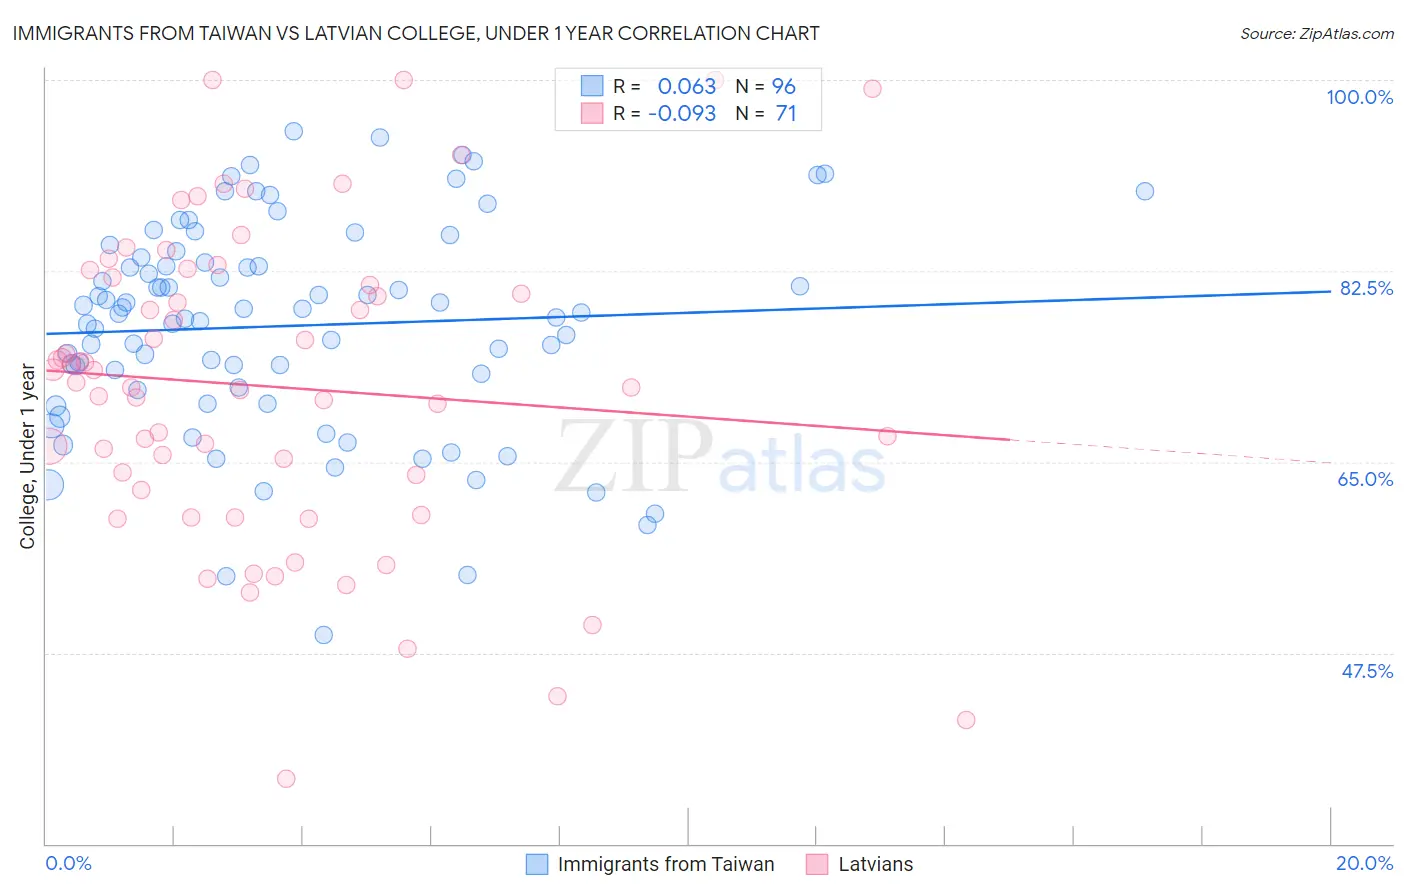
Immigrants from Taiwan vs Latvian College, Under 1 year Correlation Chart
The statistical analysis conducted on geographies consisting of 298,292,490 people shows a slight positive correlation between the proportion of Immigrants from Taiwan and percentage of population with at least college, under 1 year education in the United States with a correlation coefficient (R) of 0.063 and weighted average of 74.2%. Similarly, the statistical analysis conducted on geographies consisting of 220,726,880 people shows a slight negative correlation between the proportion of Latvians and percentage of population with at least college, under 1 year education in the United States with a correlation coefficient (R) of -0.093 and weighted average of 71.6%, a difference of 3.6%.
College, Under 1 year Correlation Summary
| Measurement | Immigrants from Taiwan | Latvian |
| Minimum | 49.2% | 36.0% |
| Maximum | 95.3% | 100.0% |
| Range | 46.1% | 64.0% |
| Mean | 77.5% | 71.9% |
| Median | 78.6% | 72.3% |
| Interquartile 25% (IQ1) | 71.7% | 62.5% |
| Interquartile 75% (IQ3) | 83.5% | 81.9% |
| Interquartile Range (IQR) | 11.8% | 19.4% |
| Standard Deviation (Sample) | 9.7% | 14.2% |
| Standard Deviation (Population) | 9.6% | 14.1% |
Demographics Similar to Immigrants from Taiwan and Latvians by College, Under 1 year
In terms of college, under 1 year, the demographic groups most similar to Immigrants from Taiwan are Immigrants from Iran (74.3%, a difference of 0.11%), Immigrants from India (74.4%, a difference of 0.34%), Okinawan (73.7%, a difference of 0.70%), Immigrants from Singapore (74.8%, a difference of 0.85%), and Iranian (74.9%, a difference of 0.90%). Similarly, the demographic groups most similar to Latvians are Immigrants from Korea (71.6%, a difference of 0.040%), Immigrants from Switzerland (71.7%, a difference of 0.11%), Immigrants from Belgium (71.5%, a difference of 0.19%), Eastern European (71.8%, a difference of 0.24%), and Immigrants from Japan (71.9%, a difference of 0.39%).
| Demographics | Rating | Rank | College, Under 1 year |
| Iranians | 100.0 /100 | #2 | Exceptional 74.9% |
| Immigrants | Singapore | 100.0 /100 | #3 | Exceptional 74.8% |
| Immigrants | India | 100.0 /100 | #4 | Exceptional 74.4% |
| Immigrants | Iran | 100.0 /100 | #5 | Exceptional 74.3% |
| Immigrants | Taiwan | 100.0 /100 | #6 | Exceptional 74.2% |
| Okinawans | 100.0 /100 | #7 | Exceptional 73.7% |
| Thais | 100.0 /100 | #8 | Exceptional 73.4% |
| Immigrants | Australia | 100.0 /100 | #9 | Exceptional 72.7% |
| Immigrants | Israel | 100.0 /100 | #10 | Exceptional 72.3% |
| Immigrants | South Central Asia | 100.0 /100 | #11 | Exceptional 72.1% |
| Immigrants | Sweden | 100.0 /100 | #12 | Exceptional 72.1% |
| Cypriots | 100.0 /100 | #13 | Exceptional 72.0% |
| Cambodians | 100.0 /100 | #14 | Exceptional 71.9% |
| Burmese | 100.0 /100 | #15 | Exceptional 71.9% |
| Immigrants | Japan | 100.0 /100 | #16 | Exceptional 71.9% |
| Eastern Europeans | 100.0 /100 | #17 | Exceptional 71.8% |
| Immigrants | Switzerland | 100.0 /100 | #18 | Exceptional 71.7% |
| Latvians | 100.0 /100 | #19 | Exceptional 71.6% |
| Immigrants | Korea | 100.0 /100 | #20 | Exceptional 71.6% |
| Immigrants | Belgium | 100.0 /100 | #21 | Exceptional 71.5% |
| Immigrants | Eastern Asia | 100.0 /100 | #22 | Exceptional 71.3% |