Immigrants from Taiwan vs Latvian Male Disability
COMPARE
Immigrants from Taiwan
Latvian
Male Disability
Male Disability Comparison
Immigrants from Taiwan
Latvians
9.1%
MALE DISABILITY
100.0/ 100
METRIC RATING
2nd/ 347
METRIC RANK
11.1%
MALE DISABILITY
68.1/ 100
METRIC RATING
158th/ 347
METRIC RANK
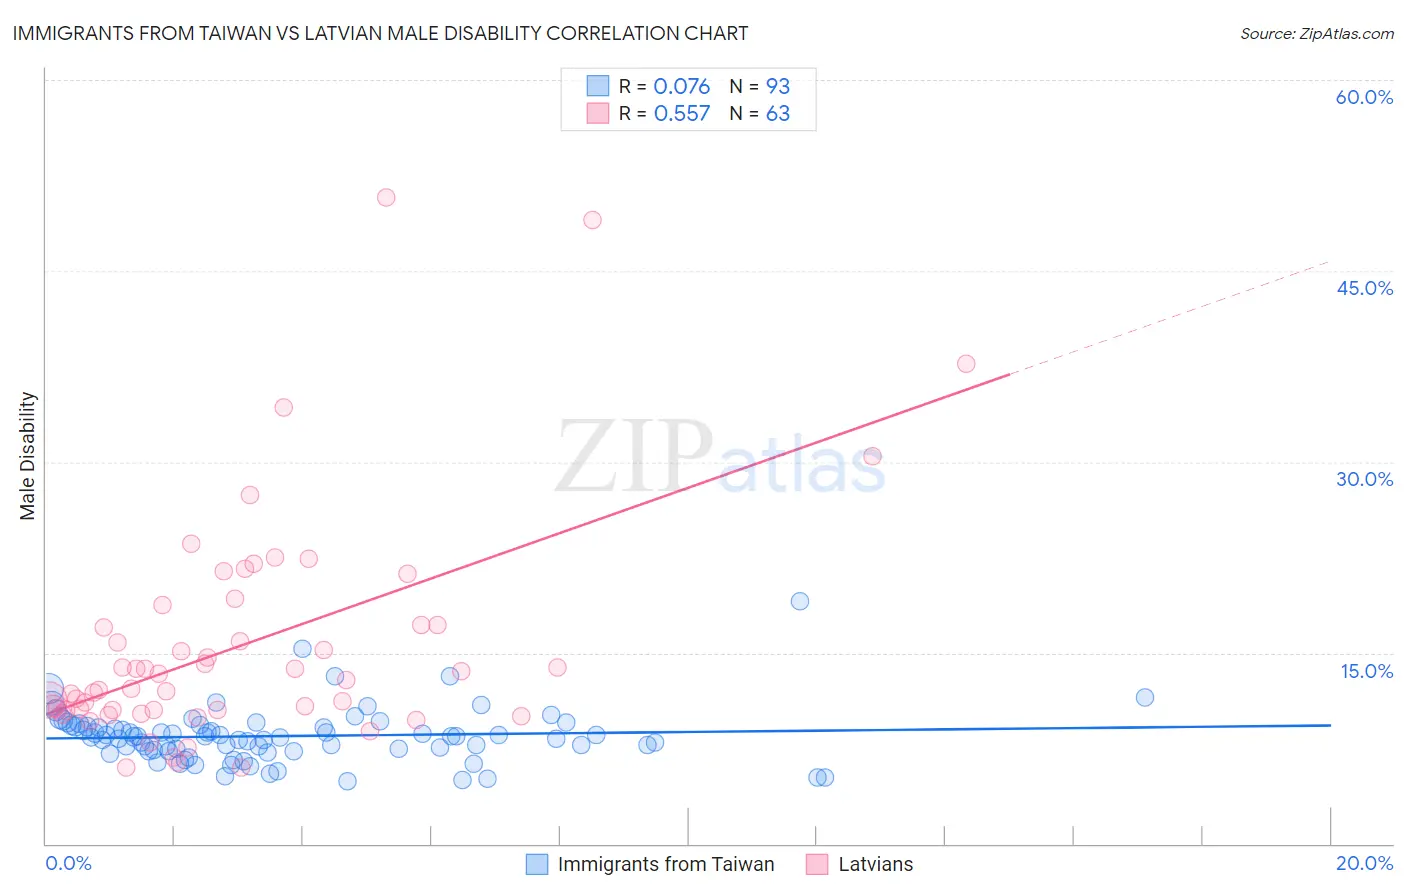
Immigrants from Taiwan vs Latvian Male Disability Correlation Chart
The statistical analysis conducted on geographies consisting of 298,235,665 people shows a slight positive correlation between the proportion of Immigrants from Taiwan and percentage of males with a disability in the United States with a correlation coefficient (R) of 0.076 and weighted average of 9.1%. Similarly, the statistical analysis conducted on geographies consisting of 220,715,476 people shows a substantial positive correlation between the proportion of Latvians and percentage of males with a disability in the United States with a correlation coefficient (R) of 0.557 and weighted average of 11.1%, a difference of 21.8%.
Male Disability Correlation Summary
| Measurement | Immigrants from Taiwan | Latvian |
| Minimum | 4.9% | 6.0% |
| Maximum | 19.0% | 50.8% |
| Range | 14.1% | 44.8% |
| Mean | 8.5% | 15.6% |
| Median | 8.4% | 12.8% |
| Interquartile 25% (IQ1) | 7.3% | 10.5% |
| Interquartile 75% (IQ3) | 9.3% | 17.2% |
| Interquartile Range (IQR) | 1.9% | 6.7% |
| Standard Deviation (Sample) | 2.1% | 9.0% |
| Standard Deviation (Population) | 2.1% | 8.9% |
Similar Demographics by Male Disability
Demographics Similar to Immigrants from Taiwan by Male Disability
In terms of male disability, the demographic groups most similar to Immigrants from Taiwan are Filipino (9.1%, a difference of 0.010%), Immigrants from India (9.0%, a difference of 0.89%), Thai (9.2%, a difference of 1.3%), Immigrants from Hong Kong (9.4%, a difference of 3.4%), and Immigrants from South Central Asia (9.4%, a difference of 3.5%).
| Demographics | Rating | Rank | Male Disability |
| Immigrants | India | 100.0 /100 | #1 | Exceptional 9.0% |
| Immigrants | Taiwan | 100.0 /100 | #2 | Exceptional 9.1% |
| Filipinos | 100.0 /100 | #3 | Exceptional 9.1% |
| Thais | 100.0 /100 | #4 | Exceptional 9.2% |
| Immigrants | Hong Kong | 100.0 /100 | #5 | Exceptional 9.4% |
| Immigrants | South Central Asia | 100.0 /100 | #6 | Exceptional 9.4% |
| Immigrants | Bolivia | 100.0 /100 | #7 | Exceptional 9.5% |
| Immigrants | China | 100.0 /100 | #8 | Exceptional 9.5% |
| Immigrants | Singapore | 100.0 /100 | #9 | Exceptional 9.5% |
| Immigrants | Israel | 100.0 /100 | #10 | Exceptional 9.6% |
| Immigrants | Eastern Asia | 100.0 /100 | #11 | Exceptional 9.6% |
| Bolivians | 100.0 /100 | #12 | Exceptional 9.6% |
| Iranians | 100.0 /100 | #13 | Exceptional 9.7% |
| Immigrants | Iran | 100.0 /100 | #14 | Exceptional 9.7% |
| Indians (Asian) | 100.0 /100 | #15 | Exceptional 9.7% |
Demographics Similar to Latvians by Male Disability
In terms of male disability, the demographic groups most similar to Latvians are Guatemalan (11.1%, a difference of 0.060%), Immigrants from Western Africa (11.1%, a difference of 0.070%), Russian (11.1%, a difference of 0.11%), Albanian (11.1%, a difference of 0.11%), and Immigrants from West Indies (11.1%, a difference of 0.16%).
| Demographics | Rating | Rank | Male Disability |
| Cubans | 74.9 /100 | #151 | Good 11.0% |
| Immigrants | Albania | 74.4 /100 | #152 | Good 11.0% |
| Immigrants | Northern Europe | 73.2 /100 | #153 | Good 11.1% |
| Immigrants | Moldova | 72.8 /100 | #154 | Good 11.1% |
| Immigrants | Middle Africa | 70.9 /100 | #155 | Good 11.1% |
| Russians | 69.8 /100 | #156 | Good 11.1% |
| Immigrants | Western Africa | 69.2 /100 | #157 | Good 11.1% |
| Latvians | 68.1 /100 | #158 | Good 11.1% |
| Guatemalans | 67.2 /100 | #159 | Good 11.1% |
| Albanians | 66.5 /100 | #160 | Good 11.1% |
| Immigrants | West Indies | 65.7 /100 | #161 | Good 11.1% |
| Immigrants | Haiti | 65.3 /100 | #162 | Good 11.1% |
| Immigrants | Kenya | 63.8 /100 | #163 | Good 11.1% |
| British West Indians | 62.8 /100 | #164 | Good 11.1% |
| Luxembourgers | 61.9 /100 | #165 | Good 11.1% |