Immigrants from Taiwan vs Immigrants from Bangladesh College, Under 1 year
COMPARE
Immigrants from Taiwan
Immigrants from Bangladesh
College, Under 1 year
College, Under 1 year Comparison
Immigrants from Taiwan
Immigrants from Bangladesh
74.2%
COLLEGE, UNDER 1 YEAR
100.0/ 100
METRIC RATING
6th/ 347
METRIC RANK
61.3%
COLLEGE, UNDER 1 YEAR
0.3/ 100
METRIC RATING
258th/ 347
METRIC RANK
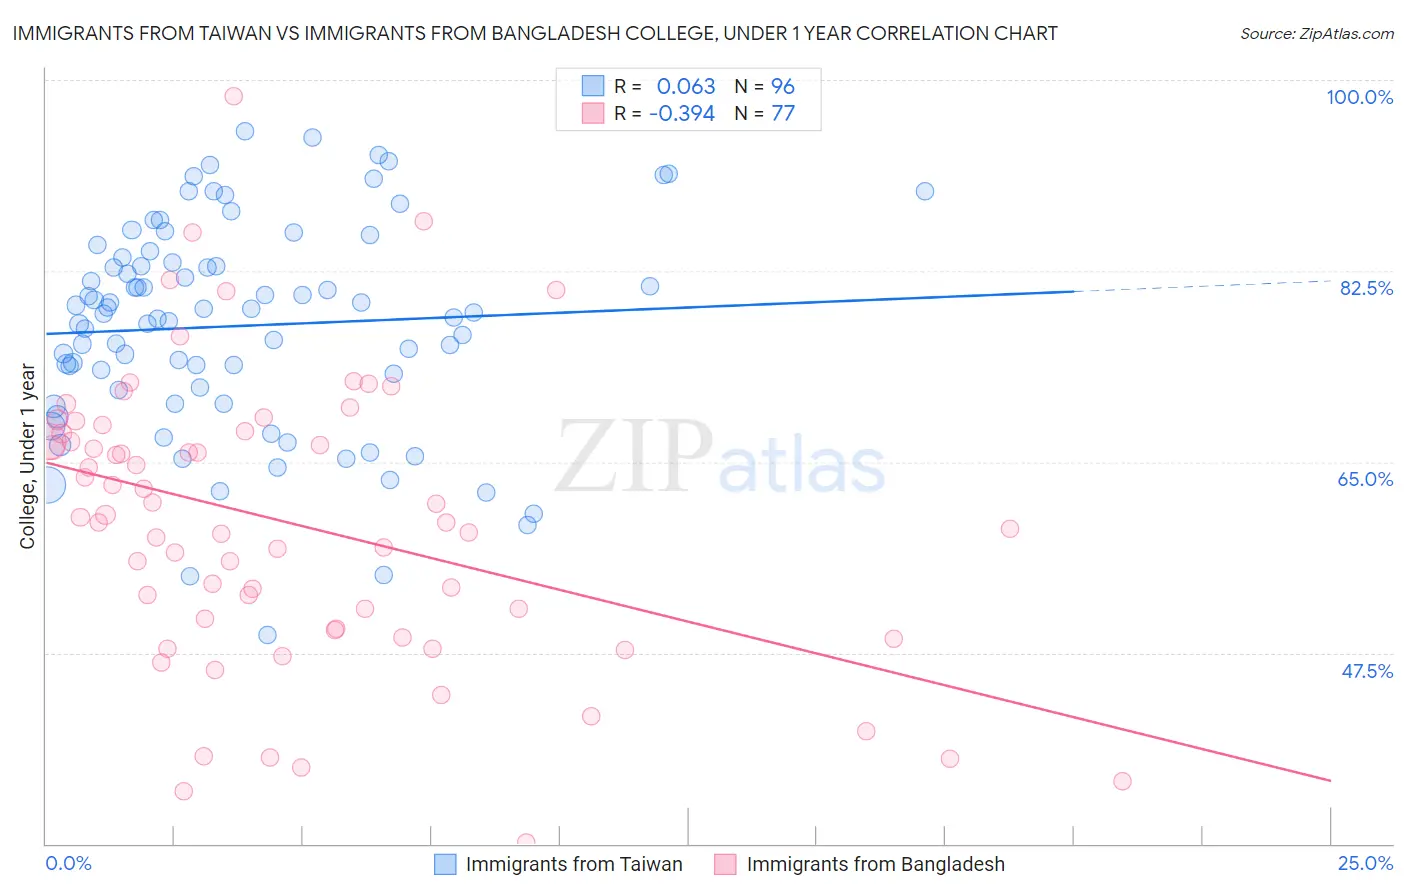
Immigrants from Taiwan vs Immigrants from Bangladesh College, Under 1 year Correlation Chart
The statistical analysis conducted on geographies consisting of 298,292,490 people shows a slight positive correlation between the proportion of Immigrants from Taiwan and percentage of population with at least college, under 1 year education in the United States with a correlation coefficient (R) of 0.063 and weighted average of 74.2%. Similarly, the statistical analysis conducted on geographies consisting of 203,680,658 people shows a mild negative correlation between the proportion of Immigrants from Bangladesh and percentage of population with at least college, under 1 year education in the United States with a correlation coefficient (R) of -0.394 and weighted average of 61.3%, a difference of 21.1%.
College, Under 1 year Correlation Summary
| Measurement | Immigrants from Taiwan | Immigrants from Bangladesh |
| Minimum | 49.2% | 30.1% |
| Maximum | 95.3% | 98.6% |
| Range | 46.1% | 68.5% |
| Mean | 77.5% | 59.4% |
| Median | 78.6% | 59.4% |
| Interquartile 25% (IQ1) | 71.7% | 49.6% |
| Interquartile 75% (IQ3) | 83.5% | 67.7% |
| Interquartile Range (IQR) | 11.8% | 18.1% |
| Standard Deviation (Sample) | 9.7% | 13.2% |
| Standard Deviation (Population) | 9.6% | 13.1% |
Similar Demographics by College, Under 1 year
Demographics Similar to Immigrants from Taiwan by College, Under 1 year
In terms of college, under 1 year, the demographic groups most similar to Immigrants from Taiwan are Immigrants from Iran (74.3%, a difference of 0.11%), Immigrants from India (74.4%, a difference of 0.34%), Okinawan (73.7%, a difference of 0.70%), Immigrants from Singapore (74.8%, a difference of 0.85%), and Iranian (74.9%, a difference of 0.90%).
| Demographics | Rating | Rank | College, Under 1 year |
| Filipinos | 100.0 /100 | #1 | Exceptional 75.5% |
| Iranians | 100.0 /100 | #2 | Exceptional 74.9% |
| Immigrants | Singapore | 100.0 /100 | #3 | Exceptional 74.8% |
| Immigrants | India | 100.0 /100 | #4 | Exceptional 74.4% |
| Immigrants | Iran | 100.0 /100 | #5 | Exceptional 74.3% |
| Immigrants | Taiwan | 100.0 /100 | #6 | Exceptional 74.2% |
| Okinawans | 100.0 /100 | #7 | Exceptional 73.7% |
| Thais | 100.0 /100 | #8 | Exceptional 73.4% |
| Immigrants | Australia | 100.0 /100 | #9 | Exceptional 72.7% |
| Immigrants | Israel | 100.0 /100 | #10 | Exceptional 72.3% |
| Immigrants | South Central Asia | 100.0 /100 | #11 | Exceptional 72.1% |
| Immigrants | Sweden | 100.0 /100 | #12 | Exceptional 72.1% |
| Cypriots | 100.0 /100 | #13 | Exceptional 72.0% |
| Cambodians | 100.0 /100 | #14 | Exceptional 71.9% |
| Burmese | 100.0 /100 | #15 | Exceptional 71.9% |
Demographics Similar to Immigrants from Bangladesh by College, Under 1 year
In terms of college, under 1 year, the demographic groups most similar to Immigrants from Bangladesh are Indonesian (61.2%, a difference of 0.020%), Immigrants from Laos (61.3%, a difference of 0.060%), Bangladeshi (61.4%, a difference of 0.17%), Blackfeet (61.1%, a difference of 0.19%), and Comanche (61.4%, a difference of 0.22%).
| Demographics | Rating | Rank | College, Under 1 year |
| Immigrants | Micronesia | 0.5 /100 | #251 | Tragic 61.5% |
| West Indians | 0.4 /100 | #252 | Tragic 61.5% |
| Japanese | 0.4 /100 | #253 | Tragic 61.5% |
| Immigrants | Cambodia | 0.4 /100 | #254 | Tragic 61.5% |
| Comanche | 0.4 /100 | #255 | Tragic 61.4% |
| Bangladeshis | 0.4 /100 | #256 | Tragic 61.4% |
| Immigrants | Laos | 0.3 /100 | #257 | Tragic 61.3% |
| Immigrants | Bangladesh | 0.3 /100 | #258 | Tragic 61.3% |
| Indonesians | 0.3 /100 | #259 | Tragic 61.2% |
| Blackfeet | 0.3 /100 | #260 | Tragic 61.1% |
| Africans | 0.3 /100 | #261 | Tragic 61.1% |
| Barbadians | 0.2 /100 | #262 | Tragic 61.1% |
| Shoshone | 0.2 /100 | #263 | Tragic 61.1% |
| Trinidadians and Tobagonians | 0.2 /100 | #264 | Tragic 61.1% |
| Immigrants | Bahamas | 0.2 /100 | #265 | Tragic 61.1% |