Chinese vs Latvian College, Under 1 year
COMPARE
Chinese
Latvian
College, Under 1 year
College, Under 1 year Comparison
Chinese
Latvians
68.3%
COLLEGE, UNDER 1 YEAR
98.3/ 100
METRIC RATING
87th/ 347
METRIC RANK
71.6%
COLLEGE, UNDER 1 YEAR
100.0/ 100
METRIC RATING
19th/ 347
METRIC RANK
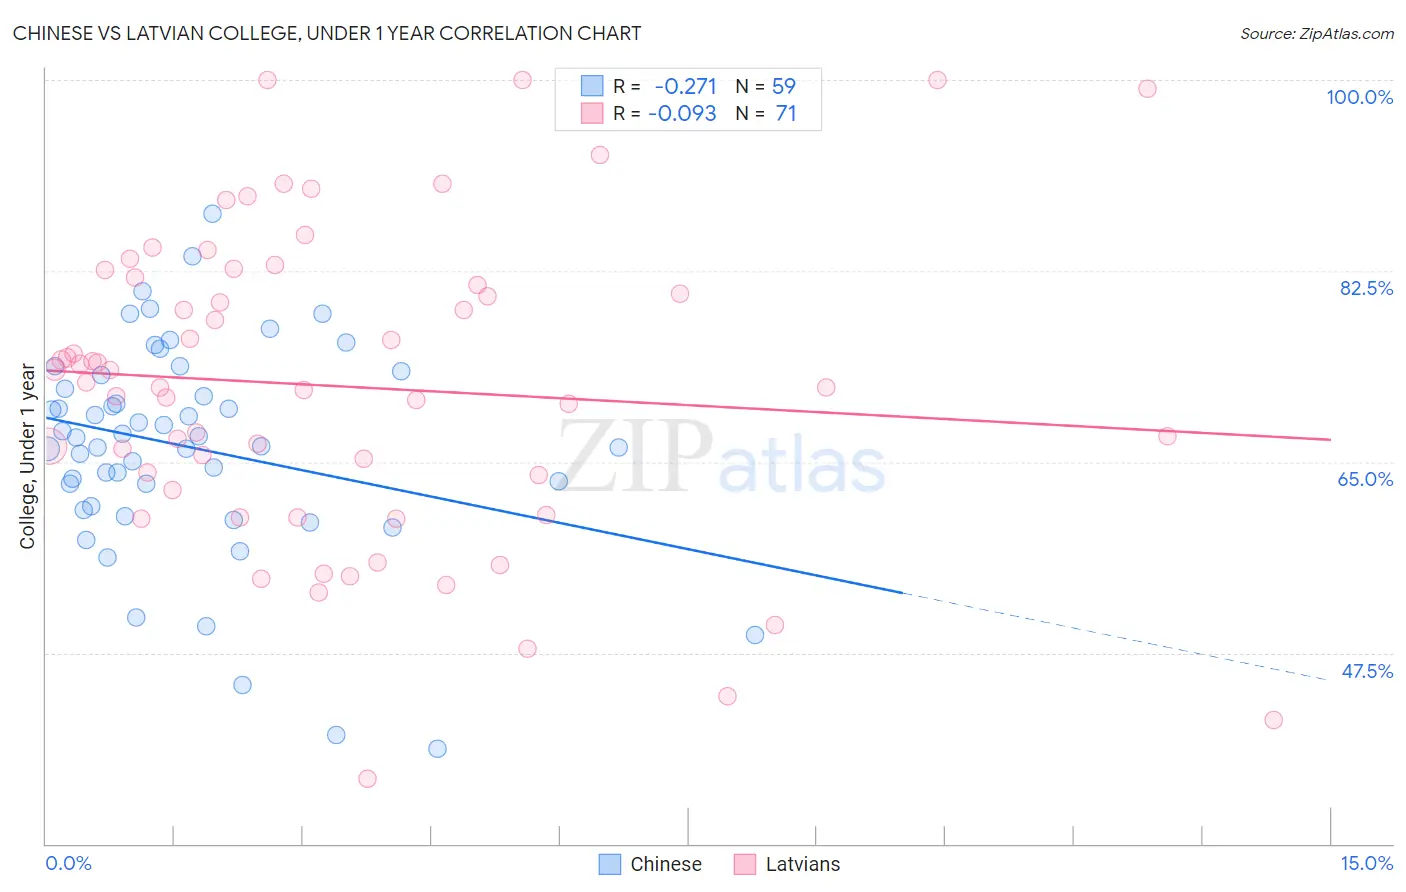
Chinese vs Latvian College, Under 1 year Correlation Chart
The statistical analysis conducted on geographies consisting of 64,809,883 people shows a weak negative correlation between the proportion of Chinese and percentage of population with at least college, under 1 year education in the United States with a correlation coefficient (R) of -0.271 and weighted average of 68.3%. Similarly, the statistical analysis conducted on geographies consisting of 220,726,880 people shows a slight negative correlation between the proportion of Latvians and percentage of population with at least college, under 1 year education in the United States with a correlation coefficient (R) of -0.093 and weighted average of 71.6%, a difference of 4.8%.
College, Under 1 year Correlation Summary
| Measurement | Chinese | Latvian |
| Minimum | 38.7% | 36.0% |
| Maximum | 87.7% | 100.0% |
| Range | 49.1% | 64.0% |
| Mean | 66.3% | 71.9% |
| Median | 67.3% | 72.3% |
| Interquartile 25% (IQ1) | 60.9% | 62.5% |
| Interquartile 75% (IQ3) | 73.0% | 81.9% |
| Interquartile Range (IQR) | 12.1% | 19.4% |
| Standard Deviation (Sample) | 9.8% | 14.2% |
| Standard Deviation (Population) | 9.7% | 14.1% |
Similar Demographics by College, Under 1 year
Demographics Similar to Chinese by College, Under 1 year
In terms of college, under 1 year, the demographic groups most similar to Chinese are Immigrants from Lebanon (68.3%, a difference of 0.020%), Croatian (68.3%, a difference of 0.020%), Immigrants from Hungary (68.3%, a difference of 0.030%), Egyptian (68.3%, a difference of 0.030%), and Ethiopian (68.3%, a difference of 0.030%).
| Demographics | Rating | Rank | College, Under 1 year |
| Immigrants | Spain | 98.5 /100 | #80 | Exceptional 68.4% |
| Immigrants | Greece | 98.5 /100 | #81 | Exceptional 68.4% |
| Norwegians | 98.4 /100 | #82 | Exceptional 68.4% |
| Argentineans | 98.4 /100 | #83 | Exceptional 68.4% |
| Immigrants | Hungary | 98.3 /100 | #84 | Exceptional 68.3% |
| Egyptians | 98.3 /100 | #85 | Exceptional 68.3% |
| Immigrants | Lebanon | 98.3 /100 | #86 | Exceptional 68.3% |
| Chinese | 98.3 /100 | #87 | Exceptional 68.3% |
| Croatians | 98.2 /100 | #88 | Exceptional 68.3% |
| Ethiopians | 98.2 /100 | #89 | Exceptional 68.3% |
| Icelanders | 98.1 /100 | #90 | Exceptional 68.3% |
| Europeans | 98.1 /100 | #91 | Exceptional 68.2% |
| Luxembourgers | 98.1 /100 | #92 | Exceptional 68.2% |
| Romanians | 97.9 /100 | #93 | Exceptional 68.2% |
| Armenians | 97.7 /100 | #94 | Exceptional 68.1% |
Demographics Similar to Latvians by College, Under 1 year
In terms of college, under 1 year, the demographic groups most similar to Latvians are Immigrants from Korea (71.6%, a difference of 0.040%), Immigrants from Switzerland (71.7%, a difference of 0.11%), Immigrants from Belgium (71.5%, a difference of 0.19%), Eastern European (71.8%, a difference of 0.24%), and Immigrants from Japan (71.9%, a difference of 0.39%).
| Demographics | Rating | Rank | College, Under 1 year |
| Immigrants | Sweden | 100.0 /100 | #12 | Exceptional 72.1% |
| Cypriots | 100.0 /100 | #13 | Exceptional 72.0% |
| Cambodians | 100.0 /100 | #14 | Exceptional 71.9% |
| Burmese | 100.0 /100 | #15 | Exceptional 71.9% |
| Immigrants | Japan | 100.0 /100 | #16 | Exceptional 71.9% |
| Eastern Europeans | 100.0 /100 | #17 | Exceptional 71.8% |
| Immigrants | Switzerland | 100.0 /100 | #18 | Exceptional 71.7% |
| Latvians | 100.0 /100 | #19 | Exceptional 71.6% |
| Immigrants | Korea | 100.0 /100 | #20 | Exceptional 71.6% |
| Immigrants | Belgium | 100.0 /100 | #21 | Exceptional 71.5% |
| Immigrants | Eastern Asia | 100.0 /100 | #22 | Exceptional 71.3% |
| Immigrants | Northern Europe | 100.0 /100 | #23 | Exceptional 71.1% |
| Soviet Union | 100.0 /100 | #24 | Exceptional 71.1% |
| Bulgarians | 100.0 /100 | #25 | Exceptional 71.1% |
| Immigrants | Denmark | 100.0 /100 | #26 | Exceptional 71.0% |