Chickasaw vs Latvian College, Under 1 year
COMPARE
Chickasaw
Latvian
College, Under 1 year
College, Under 1 year Comparison
Chickasaw
Latvians
60.4%
COLLEGE, UNDER 1 YEAR
0.1/ 100
METRIC RATING
273rd/ 347
METRIC RANK
71.6%
COLLEGE, UNDER 1 YEAR
100.0/ 100
METRIC RATING
19th/ 347
METRIC RANK
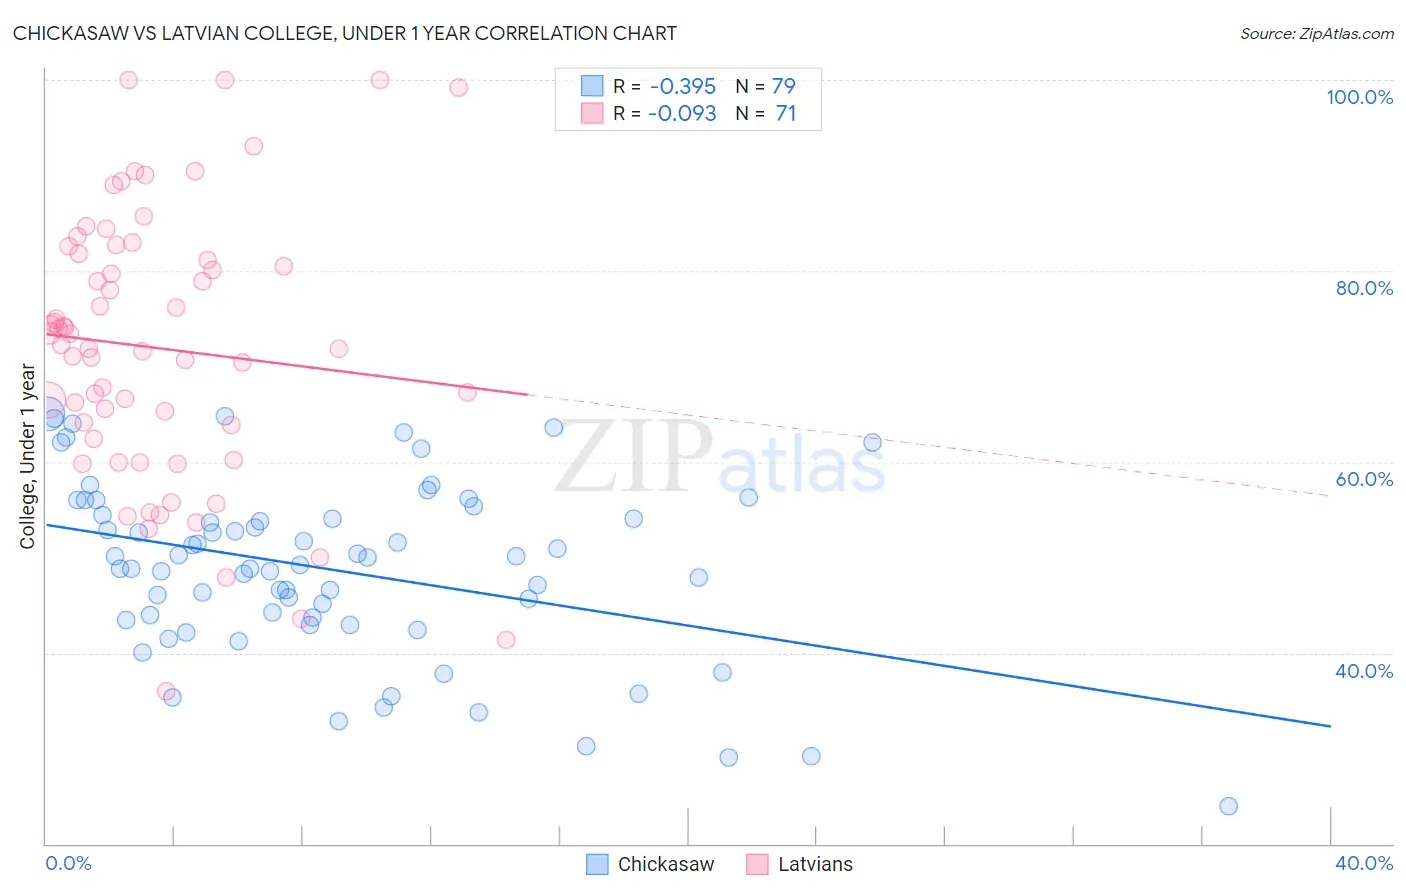
Chickasaw vs Latvian College, Under 1 year Correlation Chart
The statistical analysis conducted on geographies consisting of 147,726,589 people shows a mild negative correlation between the proportion of Chickasaw and percentage of population with at least college, under 1 year education in the United States with a correlation coefficient (R) of -0.395 and weighted average of 60.4%. Similarly, the statistical analysis conducted on geographies consisting of 220,726,880 people shows a slight negative correlation between the proportion of Latvians and percentage of population with at least college, under 1 year education in the United States with a correlation coefficient (R) of -0.093 and weighted average of 71.6%, a difference of 18.4%.
College, Under 1 year Correlation Summary
| Measurement | Chickasaw | Latvian |
| Minimum | 23.9% | 36.0% |
| Maximum | 65.1% | 100.0% |
| Range | 41.2% | 64.0% |
| Mean | 48.7% | 71.9% |
| Median | 49.2% | 72.3% |
| Interquartile 25% (IQ1) | 43.4% | 62.5% |
| Interquartile 75% (IQ3) | 54.5% | 81.9% |
| Interquartile Range (IQR) | 11.1% | 19.4% |
| Standard Deviation (Sample) | 9.2% | 14.2% |
| Standard Deviation (Population) | 9.2% | 14.1% |
Similar Demographics by College, Under 1 year
Demographics Similar to Chickasaw by College, Under 1 year
In terms of college, under 1 year, the demographic groups most similar to Chickasaw are Alaska Native (60.4%, a difference of 0.0%), Jamaican (60.5%, a difference of 0.050%), Immigrants from Barbados (60.4%, a difference of 0.13%), Arapaho (60.3%, a difference of 0.16%), and U.S. Virgin Islander (60.6%, a difference of 0.20%).
| Demographics | Rating | Rank | College, Under 1 year |
| Alaskan Athabascans | 0.2 /100 | #266 | Tragic 61.0% |
| Americans | 0.2 /100 | #267 | Tragic 61.0% |
| Immigrants | Trinidad and Tobago | 0.1 /100 | #268 | Tragic 60.7% |
| Immigrants | West Indies | 0.1 /100 | #269 | Tragic 60.6% |
| Cheyenne | 0.1 /100 | #270 | Tragic 60.6% |
| U.S. Virgin Islanders | 0.1 /100 | #271 | Tragic 60.6% |
| Jamaicans | 0.1 /100 | #272 | Tragic 60.5% |
| Chickasaw | 0.1 /100 | #273 | Tragic 60.4% |
| Alaska Natives | 0.1 /100 | #274 | Tragic 60.4% |
| Immigrants | Barbados | 0.1 /100 | #275 | Tragic 60.4% |
| Arapaho | 0.1 /100 | #276 | Tragic 60.3% |
| Bahamians | 0.1 /100 | #277 | Tragic 60.3% |
| Yaqui | 0.1 /100 | #278 | Tragic 60.2% |
| Ute | 0.1 /100 | #279 | Tragic 60.2% |
| Crow | 0.1 /100 | #280 | Tragic 60.2% |
Demographics Similar to Latvians by College, Under 1 year
In terms of college, under 1 year, the demographic groups most similar to Latvians are Immigrants from Korea (71.6%, a difference of 0.040%), Immigrants from Switzerland (71.7%, a difference of 0.11%), Immigrants from Belgium (71.5%, a difference of 0.19%), Eastern European (71.8%, a difference of 0.24%), and Immigrants from Japan (71.9%, a difference of 0.39%).
| Demographics | Rating | Rank | College, Under 1 year |
| Immigrants | Sweden | 100.0 /100 | #12 | Exceptional 72.1% |
| Cypriots | 100.0 /100 | #13 | Exceptional 72.0% |
| Cambodians | 100.0 /100 | #14 | Exceptional 71.9% |
| Burmese | 100.0 /100 | #15 | Exceptional 71.9% |
| Immigrants | Japan | 100.0 /100 | #16 | Exceptional 71.9% |
| Eastern Europeans | 100.0 /100 | #17 | Exceptional 71.8% |
| Immigrants | Switzerland | 100.0 /100 | #18 | Exceptional 71.7% |
| Latvians | 100.0 /100 | #19 | Exceptional 71.6% |
| Immigrants | Korea | 100.0 /100 | #20 | Exceptional 71.6% |
| Immigrants | Belgium | 100.0 /100 | #21 | Exceptional 71.5% |
| Immigrants | Eastern Asia | 100.0 /100 | #22 | Exceptional 71.3% |
| Immigrants | Northern Europe | 100.0 /100 | #23 | Exceptional 71.1% |
| Soviet Union | 100.0 /100 | #24 | Exceptional 71.1% |
| Bulgarians | 100.0 /100 | #25 | Exceptional 71.1% |
| Immigrants | Denmark | 100.0 /100 | #26 | Exceptional 71.0% |