Immigrants from Taiwan vs German College, Under 1 year
COMPARE
Immigrants from Taiwan
German
College, Under 1 year
College, Under 1 year Comparison
Immigrants from Taiwan
Germans
74.2%
COLLEGE, UNDER 1 YEAR
100.0/ 100
METRIC RATING
6th/ 347
METRIC RANK
65.6%
COLLEGE, UNDER 1 YEAR
55.7/ 100
METRIC RATING
170th/ 347
METRIC RANK
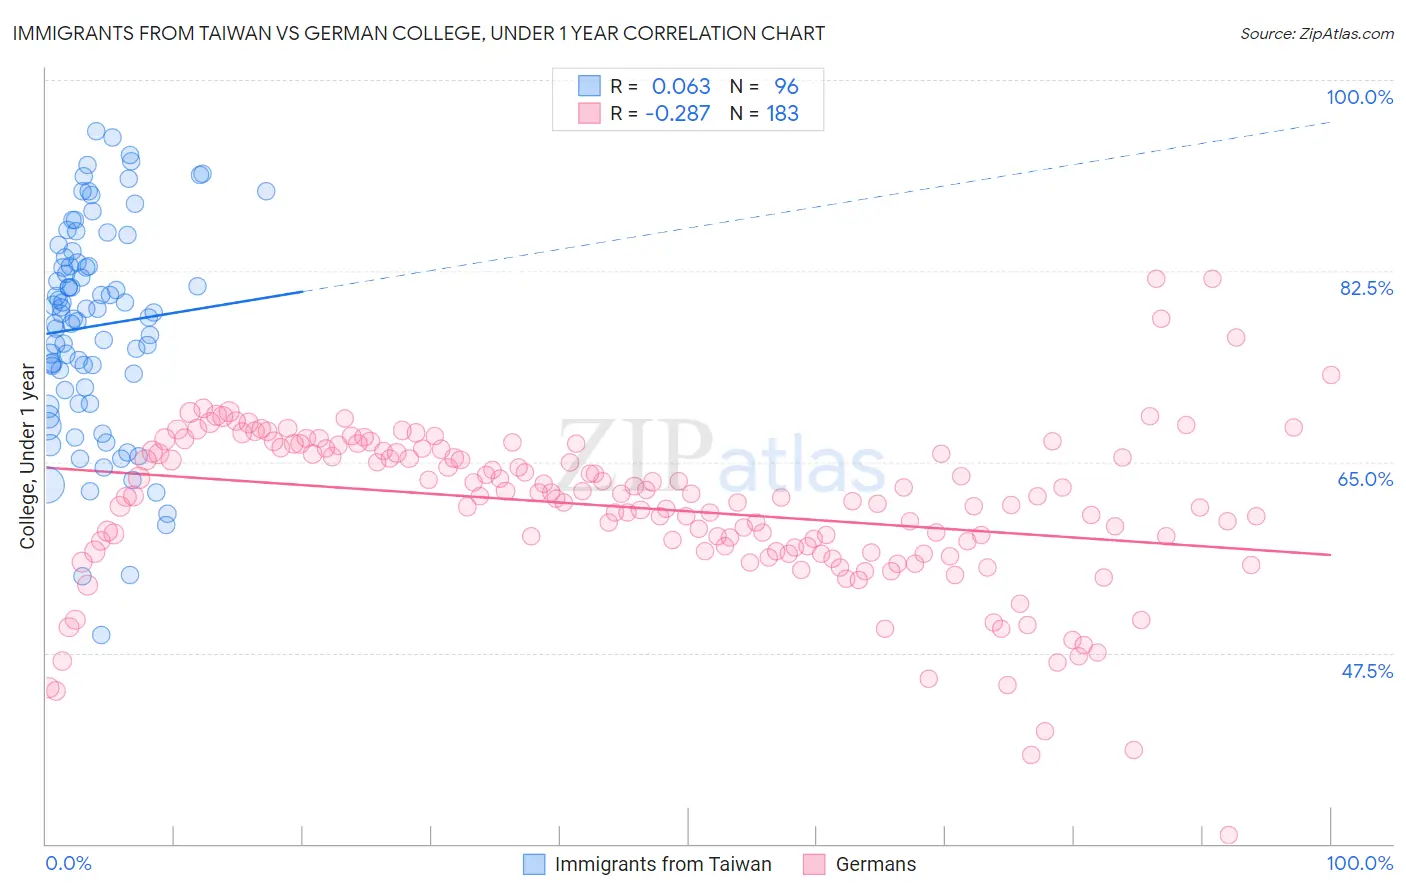
Immigrants from Taiwan vs German College, Under 1 year Correlation Chart
The statistical analysis conducted on geographies consisting of 298,292,490 people shows a slight positive correlation between the proportion of Immigrants from Taiwan and percentage of population with at least college, under 1 year education in the United States with a correlation coefficient (R) of 0.063 and weighted average of 74.2%. Similarly, the statistical analysis conducted on geographies consisting of 581,283,713 people shows a weak negative correlation between the proportion of Germans and percentage of population with at least college, under 1 year education in the United States with a correlation coefficient (R) of -0.287 and weighted average of 65.6%, a difference of 13.1%.
College, Under 1 year Correlation Summary
| Measurement | Immigrants from Taiwan | German |
| Minimum | 49.2% | 30.8% |
| Maximum | 95.3% | 81.8% |
| Range | 46.1% | 51.0% |
| Mean | 77.5% | 60.8% |
| Median | 78.6% | 61.8% |
| Interquartile 25% (IQ1) | 71.7% | 56.8% |
| Interquartile 75% (IQ3) | 83.5% | 66.1% |
| Interquartile Range (IQR) | 11.8% | 9.4% |
| Standard Deviation (Sample) | 9.7% | 7.5% |
| Standard Deviation (Population) | 9.6% | 7.5% |
Similar Demographics by College, Under 1 year
Demographics Similar to Immigrants from Taiwan by College, Under 1 year
In terms of college, under 1 year, the demographic groups most similar to Immigrants from Taiwan are Immigrants from Iran (74.3%, a difference of 0.11%), Immigrants from India (74.4%, a difference of 0.34%), Okinawan (73.7%, a difference of 0.70%), Immigrants from Singapore (74.8%, a difference of 0.85%), and Iranian (74.9%, a difference of 0.90%).
| Demographics | Rating | Rank | College, Under 1 year |
| Filipinos | 100.0 /100 | #1 | Exceptional 75.5% |
| Iranians | 100.0 /100 | #2 | Exceptional 74.9% |
| Immigrants | Singapore | 100.0 /100 | #3 | Exceptional 74.8% |
| Immigrants | India | 100.0 /100 | #4 | Exceptional 74.4% |
| Immigrants | Iran | 100.0 /100 | #5 | Exceptional 74.3% |
| Immigrants | Taiwan | 100.0 /100 | #6 | Exceptional 74.2% |
| Okinawans | 100.0 /100 | #7 | Exceptional 73.7% |
| Thais | 100.0 /100 | #8 | Exceptional 73.4% |
| Immigrants | Australia | 100.0 /100 | #9 | Exceptional 72.7% |
| Immigrants | Israel | 100.0 /100 | #10 | Exceptional 72.3% |
| Immigrants | South Central Asia | 100.0 /100 | #11 | Exceptional 72.1% |
| Immigrants | Sweden | 100.0 /100 | #12 | Exceptional 72.1% |
| Cypriots | 100.0 /100 | #13 | Exceptional 72.0% |
| Cambodians | 100.0 /100 | #14 | Exceptional 71.9% |
| Burmese | 100.0 /100 | #15 | Exceptional 71.9% |
Demographics Similar to Germans by College, Under 1 year
In terms of college, under 1 year, the demographic groups most similar to Germans are Yugoslavian (65.6%, a difference of 0.0%), Hungarian (65.6%, a difference of 0.010%), Immigrants from Somalia (65.6%, a difference of 0.030%), Immigrants from Oceania (65.6%, a difference of 0.030%), and Moroccan (65.6%, a difference of 0.040%).
| Demographics | Rating | Rank | College, Under 1 year |
| Somalis | 62.7 /100 | #163 | Good 65.8% |
| Czechoslovakians | 62.6 /100 | #164 | Good 65.8% |
| Immigrants | Uzbekistan | 61.6 /100 | #165 | Good 65.8% |
| Moroccans | 56.7 /100 | #166 | Average 65.6% |
| Immigrants | Somalia | 56.4 /100 | #167 | Average 65.6% |
| Hungarians | 55.9 /100 | #168 | Average 65.6% |
| Yugoslavians | 55.7 /100 | #169 | Average 65.6% |
| Germans | 55.7 /100 | #170 | Average 65.6% |
| Immigrants | Oceania | 55.0 /100 | #171 | Average 65.6% |
| South American Indians | 54.4 /100 | #172 | Average 65.5% |
| Swiss | 53.9 /100 | #173 | Average 65.5% |
| Immigrants | Bosnia and Herzegovina | 50.0 /100 | #174 | Average 65.4% |
| Scotch-Irish | 49.5 /100 | #175 | Average 65.4% |
| French | 48.9 /100 | #176 | Average 65.4% |
| Immigrants | North Macedonia | 48.6 /100 | #177 | Average 65.4% |