Honduran vs Latvian College, Under 1 year
COMPARE
Honduran
Latvian
College, Under 1 year
College, Under 1 year Comparison
Hondurans
Latvians
57.1%
COLLEGE, UNDER 1 YEAR
0.0/ 100
METRIC RATING
315th/ 347
METRIC RANK
71.6%
COLLEGE, UNDER 1 YEAR
100.0/ 100
METRIC RATING
19th/ 347
METRIC RANK
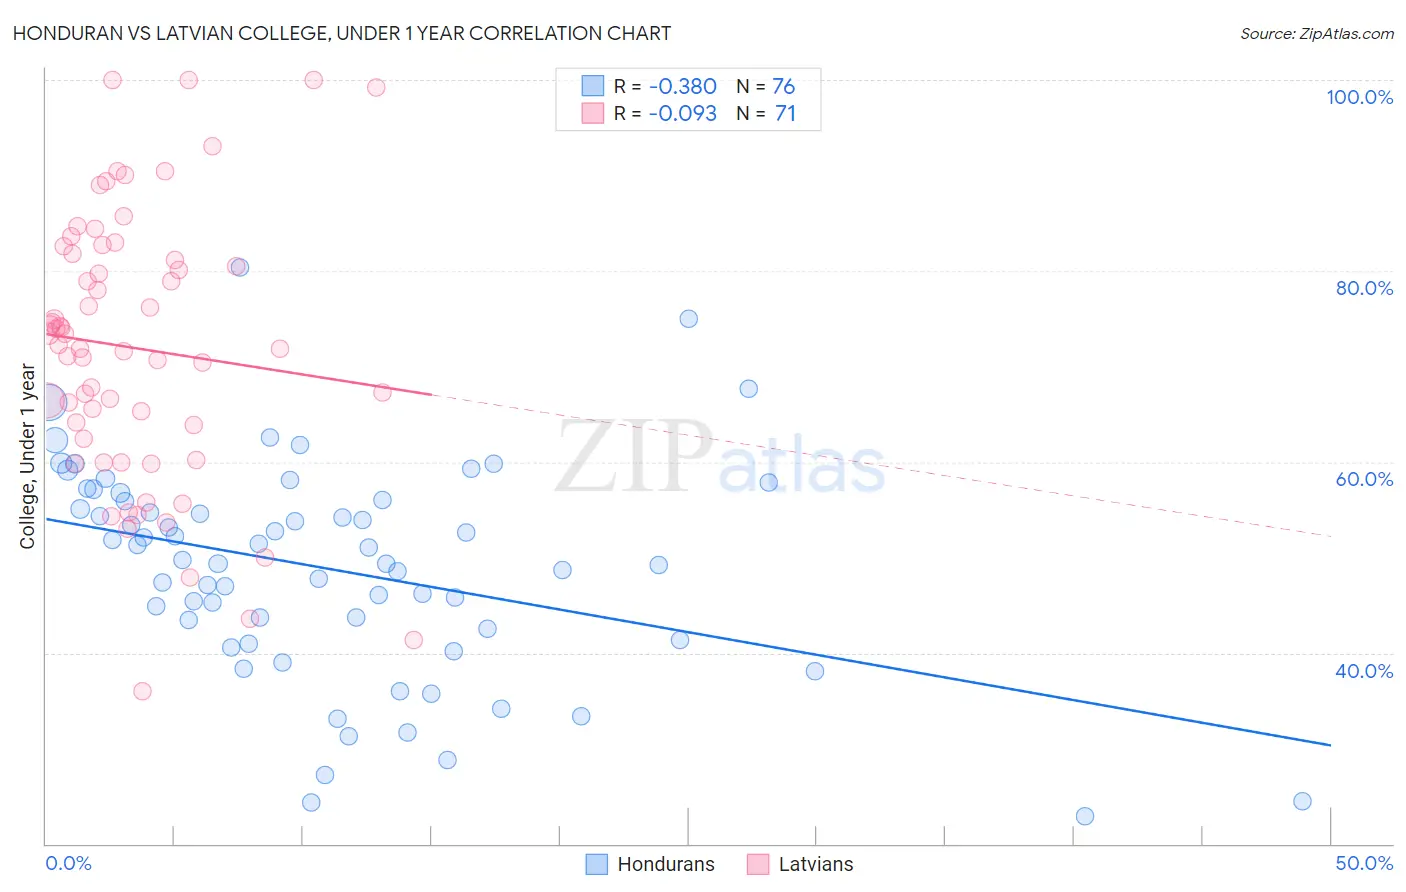
Honduran vs Latvian College, Under 1 year Correlation Chart
The statistical analysis conducted on geographies consisting of 357,856,249 people shows a mild negative correlation between the proportion of Hondurans and percentage of population with at least college, under 1 year education in the United States with a correlation coefficient (R) of -0.380 and weighted average of 57.1%. Similarly, the statistical analysis conducted on geographies consisting of 220,726,880 people shows a slight negative correlation between the proportion of Latvians and percentage of population with at least college, under 1 year education in the United States with a correlation coefficient (R) of -0.093 and weighted average of 71.6%, a difference of 25.5%.
College, Under 1 year Correlation Summary
| Measurement | Honduran | Latvian |
| Minimum | 22.9% | 36.0% |
| Maximum | 80.4% | 100.0% |
| Range | 57.4% | 64.0% |
| Mean | 48.8% | 71.9% |
| Median | 49.5% | 72.3% |
| Interquartile 25% (IQ1) | 41.9% | 62.5% |
| Interquartile 75% (IQ3) | 55.9% | 81.9% |
| Interquartile Range (IQR) | 14.0% | 19.4% |
| Standard Deviation (Sample) | 11.3% | 14.2% |
| Standard Deviation (Population) | 11.2% | 14.1% |
Similar Demographics by College, Under 1 year
Demographics Similar to Hondurans by College, Under 1 year
In terms of college, under 1 year, the demographic groups most similar to Hondurans are Hopi (57.1%, a difference of 0.040%), Menominee (57.0%, a difference of 0.050%), Hispanic or Latino (57.0%, a difference of 0.090%), Dutch West Indian (57.2%, a difference of 0.16%), and Immigrants from Haiti (56.9%, a difference of 0.21%).
| Demographics | Rating | Rank | College, Under 1 year |
| Central Americans | 0.0 /100 | #308 | Tragic 57.7% |
| Immigrants | Nicaragua | 0.0 /100 | #309 | Tragic 57.6% |
| Pueblo | 0.0 /100 | #310 | Tragic 57.4% |
| Cajuns | 0.0 /100 | #311 | Tragic 57.3% |
| Salvadorans | 0.0 /100 | #312 | Tragic 57.3% |
| Dutch West Indians | 0.0 /100 | #313 | Tragic 57.2% |
| Hopi | 0.0 /100 | #314 | Tragic 57.1% |
| Hondurans | 0.0 /100 | #315 | Tragic 57.1% |
| Menominee | 0.0 /100 | #316 | Tragic 57.0% |
| Hispanics or Latinos | 0.0 /100 | #317 | Tragic 57.0% |
| Immigrants | Haiti | 0.0 /100 | #318 | Tragic 56.9% |
| Puerto Ricans | 0.0 /100 | #319 | Tragic 56.8% |
| Guatemalans | 0.0 /100 | #320 | Tragic 56.8% |
| Natives/Alaskans | 0.0 /100 | #321 | Tragic 56.6% |
| Immigrants | Caribbean | 0.0 /100 | #322 | Tragic 56.6% |
Demographics Similar to Latvians by College, Under 1 year
In terms of college, under 1 year, the demographic groups most similar to Latvians are Immigrants from Korea (71.6%, a difference of 0.040%), Immigrants from Switzerland (71.7%, a difference of 0.11%), Immigrants from Belgium (71.5%, a difference of 0.19%), Eastern European (71.8%, a difference of 0.24%), and Immigrants from Japan (71.9%, a difference of 0.39%).
| Demographics | Rating | Rank | College, Under 1 year |
| Immigrants | Sweden | 100.0 /100 | #12 | Exceptional 72.1% |
| Cypriots | 100.0 /100 | #13 | Exceptional 72.0% |
| Cambodians | 100.0 /100 | #14 | Exceptional 71.9% |
| Burmese | 100.0 /100 | #15 | Exceptional 71.9% |
| Immigrants | Japan | 100.0 /100 | #16 | Exceptional 71.9% |
| Eastern Europeans | 100.0 /100 | #17 | Exceptional 71.8% |
| Immigrants | Switzerland | 100.0 /100 | #18 | Exceptional 71.7% |
| Latvians | 100.0 /100 | #19 | Exceptional 71.6% |
| Immigrants | Korea | 100.0 /100 | #20 | Exceptional 71.6% |
| Immigrants | Belgium | 100.0 /100 | #21 | Exceptional 71.5% |
| Immigrants | Eastern Asia | 100.0 /100 | #22 | Exceptional 71.3% |
| Immigrants | Northern Europe | 100.0 /100 | #23 | Exceptional 71.1% |
| Soviet Union | 100.0 /100 | #24 | Exceptional 71.1% |
| Bulgarians | 100.0 /100 | #25 | Exceptional 71.1% |
| Immigrants | Denmark | 100.0 /100 | #26 | Exceptional 71.0% |