Immigrants from Fiji vs Latvian College, Under 1 year
COMPARE
Immigrants from Fiji
Latvian
College, Under 1 year
College, Under 1 year Comparison
Immigrants from Fiji
Latvians
63.4%
COLLEGE, UNDER 1 YEAR
5.7/ 100
METRIC RATING
219th/ 347
METRIC RANK
71.6%
COLLEGE, UNDER 1 YEAR
100.0/ 100
METRIC RATING
19th/ 347
METRIC RANK
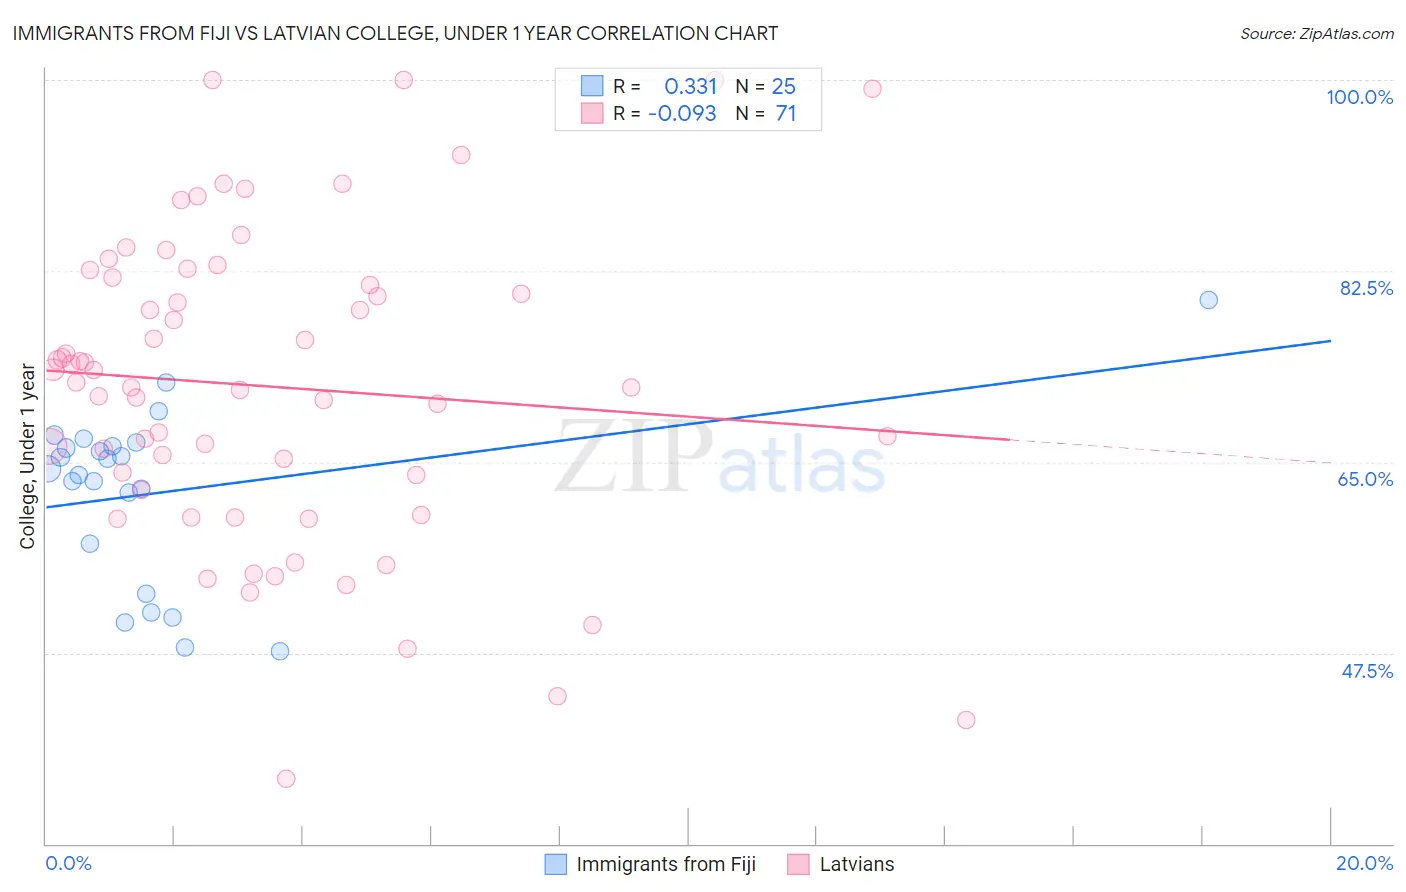
Immigrants from Fiji vs Latvian College, Under 1 year Correlation Chart
The statistical analysis conducted on geographies consisting of 93,755,737 people shows a mild positive correlation between the proportion of Immigrants from Fiji and percentage of population with at least college, under 1 year education in the United States with a correlation coefficient (R) of 0.331 and weighted average of 63.4%. Similarly, the statistical analysis conducted on geographies consisting of 220,726,880 people shows a slight negative correlation between the proportion of Latvians and percentage of population with at least college, under 1 year education in the United States with a correlation coefficient (R) of -0.093 and weighted average of 71.6%, a difference of 12.9%.
College, Under 1 year Correlation Summary
| Measurement | Immigrants from Fiji | Latvian |
| Minimum | 47.6% | 36.0% |
| Maximum | 79.8% | 100.0% |
| Range | 32.2% | 64.0% |
| Mean | 62.2% | 71.9% |
| Median | 64.3% | 72.3% |
| Interquartile 25% (IQ1) | 55.2% | 62.5% |
| Interquartile 75% (IQ3) | 66.6% | 81.9% |
| Interquartile Range (IQR) | 11.3% | 19.4% |
| Standard Deviation (Sample) | 8.0% | 14.2% |
| Standard Deviation (Population) | 7.9% | 14.1% |
Similar Demographics by College, Under 1 year
Demographics Similar to Immigrants from Fiji by College, Under 1 year
In terms of college, under 1 year, the demographic groups most similar to Immigrants from Fiji are Immigrants from Panama (63.4%, a difference of 0.010%), Portuguese (63.4%, a difference of 0.020%), Immigrants from Uruguay (63.4%, a difference of 0.030%), Cree (63.3%, a difference of 0.11%), and Immigrants from Senegal (63.3%, a difference of 0.16%).
| Demographics | Rating | Rank | College, Under 1 year |
| Immigrants | Middle Africa | 10.5 /100 | #212 | Poor 63.9% |
| Immigrants | South America | 9.1 /100 | #213 | Tragic 63.8% |
| Immigrants | Nigeria | 8.8 /100 | #214 | Tragic 63.7% |
| Senegalese | 7.7 /100 | #215 | Tragic 63.6% |
| Hmong | 6.8 /100 | #216 | Tragic 63.5% |
| Immigrants | Uruguay | 5.8 /100 | #217 | Tragic 63.4% |
| Immigrants | Panama | 5.7 /100 | #218 | Tragic 63.4% |
| Immigrants | Fiji | 5.7 /100 | #219 | Tragic 63.4% |
| Portuguese | 5.6 /100 | #220 | Tragic 63.4% |
| Cree | 5.2 /100 | #221 | Tragic 63.3% |
| Immigrants | Senegal | 5.0 /100 | #222 | Tragic 63.3% |
| Immigrants | Costa Rica | 4.5 /100 | #223 | Tragic 63.2% |
| Sub-Saharan Africans | 4.4 /100 | #224 | Tragic 63.2% |
| Immigrants | Peru | 4.0 /100 | #225 | Tragic 63.1% |
| Immigrants | Colombia | 4.0 /100 | #226 | Tragic 63.1% |
Demographics Similar to Latvians by College, Under 1 year
In terms of college, under 1 year, the demographic groups most similar to Latvians are Immigrants from Korea (71.6%, a difference of 0.040%), Immigrants from Switzerland (71.7%, a difference of 0.11%), Immigrants from Belgium (71.5%, a difference of 0.19%), Eastern European (71.8%, a difference of 0.24%), and Immigrants from Japan (71.9%, a difference of 0.39%).
| Demographics | Rating | Rank | College, Under 1 year |
| Immigrants | Sweden | 100.0 /100 | #12 | Exceptional 72.1% |
| Cypriots | 100.0 /100 | #13 | Exceptional 72.0% |
| Cambodians | 100.0 /100 | #14 | Exceptional 71.9% |
| Burmese | 100.0 /100 | #15 | Exceptional 71.9% |
| Immigrants | Japan | 100.0 /100 | #16 | Exceptional 71.9% |
| Eastern Europeans | 100.0 /100 | #17 | Exceptional 71.8% |
| Immigrants | Switzerland | 100.0 /100 | #18 | Exceptional 71.7% |
| Latvians | 100.0 /100 | #19 | Exceptional 71.6% |
| Immigrants | Korea | 100.0 /100 | #20 | Exceptional 71.6% |
| Immigrants | Belgium | 100.0 /100 | #21 | Exceptional 71.5% |
| Immigrants | Eastern Asia | 100.0 /100 | #22 | Exceptional 71.3% |
| Immigrants | Northern Europe | 100.0 /100 | #23 | Exceptional 71.1% |
| Soviet Union | 100.0 /100 | #24 | Exceptional 71.1% |
| Bulgarians | 100.0 /100 | #25 | Exceptional 71.1% |
| Immigrants | Denmark | 100.0 /100 | #26 | Exceptional 71.0% |