Immigrants from Taiwan vs Immigrants from Morocco College, Under 1 year
COMPARE
Immigrants from Taiwan
Immigrants from Morocco
College, Under 1 year
College, Under 1 year Comparison
Immigrants from Taiwan
Immigrants from Morocco
74.2%
COLLEGE, UNDER 1 YEAR
100.0/ 100
METRIC RATING
6th/ 347
METRIC RANK
66.5%
COLLEGE, UNDER 1 YEAR
81.7/ 100
METRIC RATING
147th/ 347
METRIC RANK
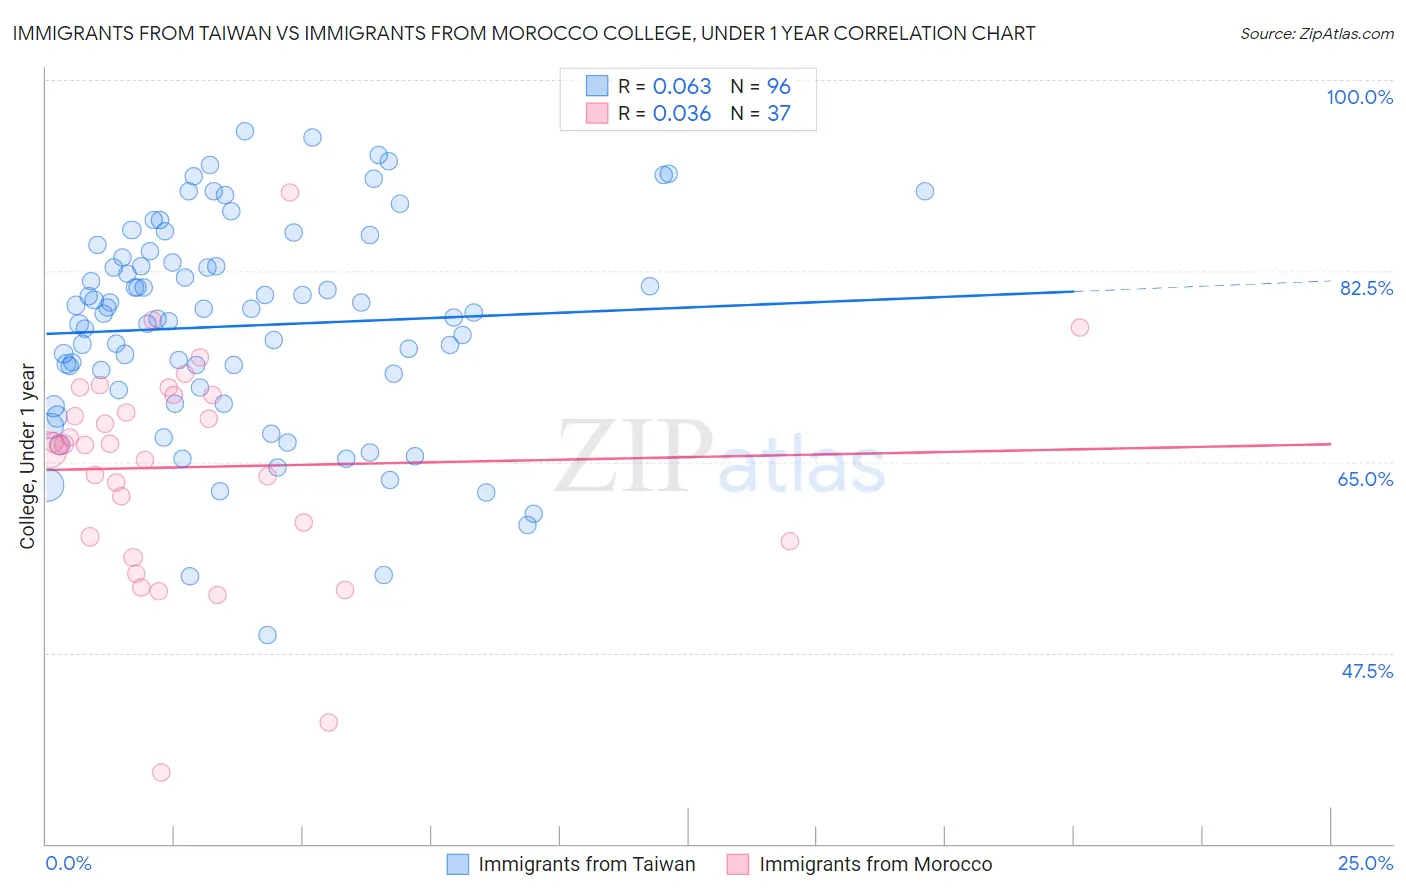
Immigrants from Taiwan vs Immigrants from Morocco College, Under 1 year Correlation Chart
The statistical analysis conducted on geographies consisting of 298,292,490 people shows a slight positive correlation between the proportion of Immigrants from Taiwan and percentage of population with at least college, under 1 year education in the United States with a correlation coefficient (R) of 0.063 and weighted average of 74.2%. Similarly, the statistical analysis conducted on geographies consisting of 178,912,438 people shows no correlation between the proportion of Immigrants from Morocco and percentage of population with at least college, under 1 year education in the United States with a correlation coefficient (R) of 0.036 and weighted average of 66.5%, a difference of 11.6%.
College, Under 1 year Correlation Summary
| Measurement | Immigrants from Taiwan | Immigrants from Morocco |
| Minimum | 49.2% | 36.5% |
| Maximum | 95.3% | 89.7% |
| Range | 46.1% | 53.2% |
| Mean | 77.5% | 64.5% |
| Median | 78.6% | 66.5% |
| Interquartile 25% (IQ1) | 71.7% | 58.0% |
| Interquartile 75% (IQ3) | 83.5% | 71.2% |
| Interquartile Range (IQR) | 11.8% | 13.2% |
| Standard Deviation (Sample) | 9.7% | 10.1% |
| Standard Deviation (Population) | 9.6% | 9.9% |
Similar Demographics by College, Under 1 year
Demographics Similar to Immigrants from Taiwan by College, Under 1 year
In terms of college, under 1 year, the demographic groups most similar to Immigrants from Taiwan are Immigrants from Iran (74.3%, a difference of 0.11%), Immigrants from India (74.4%, a difference of 0.34%), Okinawan (73.7%, a difference of 0.70%), Immigrants from Singapore (74.8%, a difference of 0.85%), and Iranian (74.9%, a difference of 0.90%).
| Demographics | Rating | Rank | College, Under 1 year |
| Filipinos | 100.0 /100 | #1 | Exceptional 75.5% |
| Iranians | 100.0 /100 | #2 | Exceptional 74.9% |
| Immigrants | Singapore | 100.0 /100 | #3 | Exceptional 74.8% |
| Immigrants | India | 100.0 /100 | #4 | Exceptional 74.4% |
| Immigrants | Iran | 100.0 /100 | #5 | Exceptional 74.3% |
| Immigrants | Taiwan | 100.0 /100 | #6 | Exceptional 74.2% |
| Okinawans | 100.0 /100 | #7 | Exceptional 73.7% |
| Thais | 100.0 /100 | #8 | Exceptional 73.4% |
| Immigrants | Australia | 100.0 /100 | #9 | Exceptional 72.7% |
| Immigrants | Israel | 100.0 /100 | #10 | Exceptional 72.3% |
| Immigrants | South Central Asia | 100.0 /100 | #11 | Exceptional 72.1% |
| Immigrants | Sweden | 100.0 /100 | #12 | Exceptional 72.1% |
| Cypriots | 100.0 /100 | #13 | Exceptional 72.0% |
| Cambodians | 100.0 /100 | #14 | Exceptional 71.9% |
| Burmese | 100.0 /100 | #15 | Exceptional 71.9% |
Demographics Similar to Immigrants from Morocco by College, Under 1 year
In terms of college, under 1 year, the demographic groups most similar to Immigrants from Morocco are Kenyan (66.5%, a difference of 0.0%), Immigrants from Kenya (66.5%, a difference of 0.010%), Immigrants from Germany (66.5%, a difference of 0.020%), Immigrants from Uganda (66.5%, a difference of 0.080%), and English (66.6%, a difference of 0.090%).
| Demographics | Rating | Rank | College, Under 1 year |
| Slavs | 85.9 /100 | #140 | Excellent 66.7% |
| Immigrants | Afghanistan | 85.1 /100 | #141 | Excellent 66.7% |
| English | 82.9 /100 | #142 | Excellent 66.6% |
| Immigrants | Uganda | 82.8 /100 | #143 | Excellent 66.5% |
| Immigrants | Germany | 82.0 /100 | #144 | Excellent 66.5% |
| Immigrants | Kenya | 81.8 /100 | #145 | Excellent 66.5% |
| Kenyans | 81.7 /100 | #146 | Excellent 66.5% |
| Immigrants | Morocco | 81.7 /100 | #147 | Excellent 66.5% |
| Taiwanese | 78.6 /100 | #148 | Good 66.4% |
| Immigrants | Venezuela | 77.9 /100 | #149 | Good 66.3% |
| Immigrants | Iraq | 77.1 /100 | #150 | Good 66.3% |
| Immigrants | Sudan | 76.0 /100 | #151 | Good 66.2% |
| Sudanese | 74.1 /100 | #152 | Good 66.2% |
| Belgians | 73.7 /100 | #153 | Good 66.2% |
| Immigrants | Eritrea | 71.9 /100 | #154 | Good 66.1% |