Immigrants from Switzerland vs Central American Indian GED/Equivalency
COMPARE
Immigrants from Switzerland
Central American Indian
GED/Equivalency
GED/Equivalency Comparison
Immigrants from Switzerland
Central American Indians
88.1%
GED/EQUIVALENCY
99.5/ 100
METRIC RATING
46th/ 347
METRIC RANK
80.6%
GED/EQUIVALENCY
0.0/ 100
METRIC RATING
316th/ 347
METRIC RANK
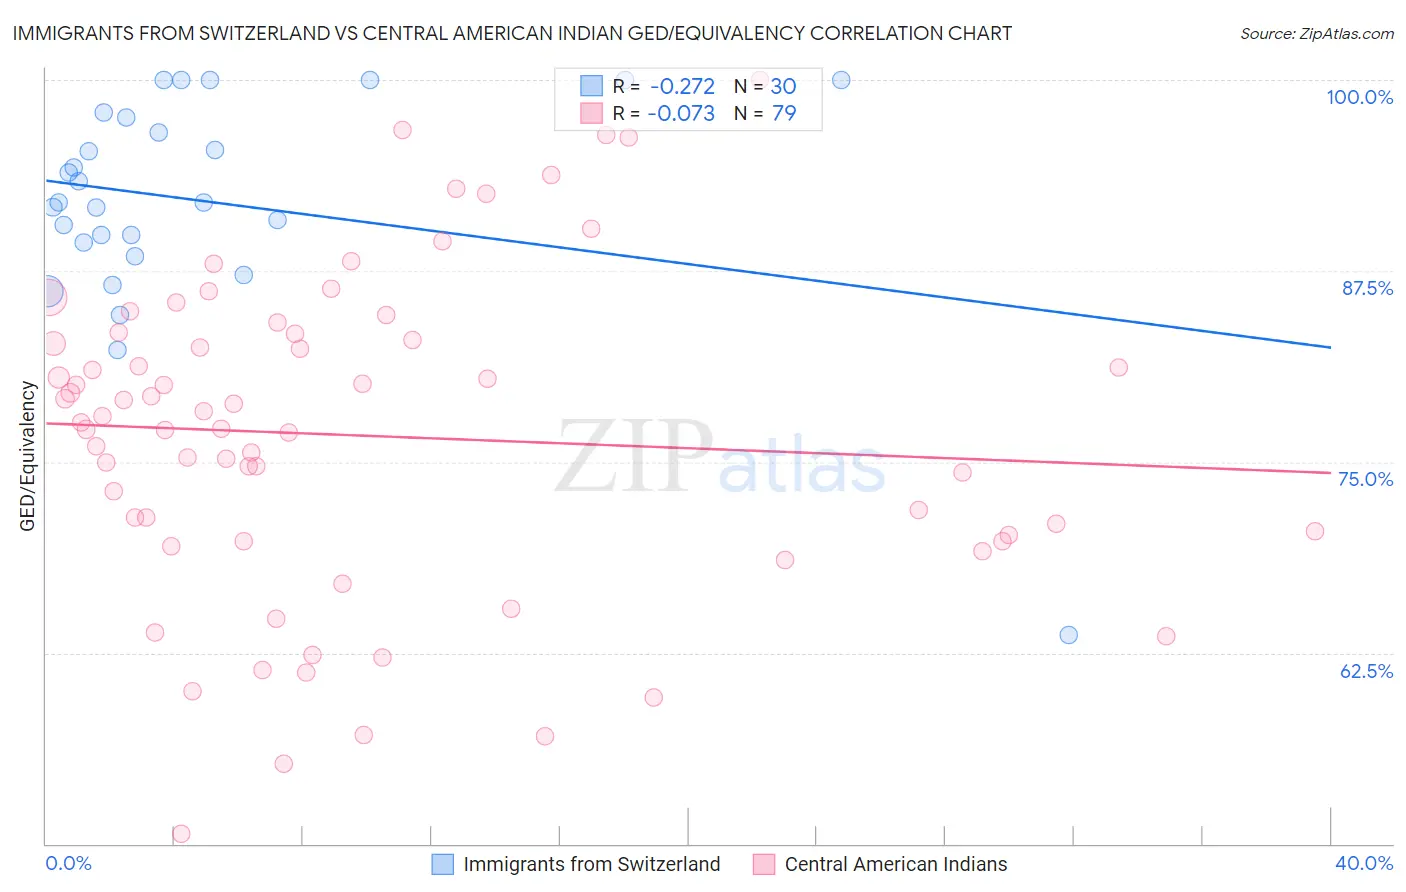
Immigrants from Switzerland vs Central American Indian GED/Equivalency Correlation Chart
The statistical analysis conducted on geographies consisting of 148,083,583 people shows a weak negative correlation between the proportion of Immigrants from Switzerland and percentage of population with at least ged/equivalency education in the United States with a correlation coefficient (R) of -0.272 and weighted average of 88.1%. Similarly, the statistical analysis conducted on geographies consisting of 326,142,643 people shows a slight negative correlation between the proportion of Central American Indians and percentage of population with at least ged/equivalency education in the United States with a correlation coefficient (R) of -0.073 and weighted average of 80.6%, a difference of 9.3%.
GED/Equivalency Correlation Summary
| Measurement | Immigrants from Switzerland | Central American Indian |
| Minimum | 63.6% | 50.7% |
| Maximum | 100.0% | 100.0% |
| Range | 36.4% | 49.3% |
| Mean | 92.0% | 76.7% |
| Median | 92.0% | 77.6% |
| Interquartile 25% (IQ1) | 89.4% | 69.8% |
| Interquartile 75% (IQ3) | 97.5% | 83.4% |
| Interquartile Range (IQR) | 8.2% | 13.6% |
| Standard Deviation (Sample) | 7.4% | 10.5% |
| Standard Deviation (Population) | 7.2% | 10.4% |
Similar Demographics by GED/Equivalency
Demographics Similar to Immigrants from Switzerland by GED/Equivalency
In terms of ged/equivalency, the demographic groups most similar to Immigrants from Switzerland are Immigrants from Latvia (88.1%, a difference of 0.010%), Czech (88.1%, a difference of 0.020%), Greek (88.1%, a difference of 0.020%), Australian (88.1%, a difference of 0.030%), and Immigrants from Korea (88.1%, a difference of 0.040%).
| Demographics | Rating | Rank | GED/Equivalency |
| Immigrants | Israel | 99.6 /100 | #39 | Exceptional 88.2% |
| Italians | 99.6 /100 | #40 | Exceptional 88.2% |
| Finns | 99.6 /100 | #41 | Exceptional 88.2% |
| Cambodians | 99.6 /100 | #42 | Exceptional 88.2% |
| Immigrants | Scotland | 99.6 /100 | #43 | Exceptional 88.2% |
| Macedonians | 99.5 /100 | #44 | Exceptional 88.1% |
| Czechs | 99.5 /100 | #45 | Exceptional 88.1% |
| Immigrants | Switzerland | 99.5 /100 | #46 | Exceptional 88.1% |
| Immigrants | Latvia | 99.5 /100 | #47 | Exceptional 88.1% |
| Greeks | 99.5 /100 | #48 | Exceptional 88.1% |
| Australians | 99.5 /100 | #49 | Exceptional 88.1% |
| Immigrants | Korea | 99.5 /100 | #50 | Exceptional 88.1% |
| Immigrants | Netherlands | 99.4 /100 | #51 | Exceptional 88.0% |
| Zimbabweans | 99.4 /100 | #52 | Exceptional 88.0% |
| Immigrants | South Africa | 99.4 /100 | #53 | Exceptional 88.0% |
Demographics Similar to Central American Indians by GED/Equivalency
In terms of ged/equivalency, the demographic groups most similar to Central American Indians are Immigrants from Caribbean (80.5%, a difference of 0.10%), Apache (80.7%, a difference of 0.13%), Yaqui (80.5%, a difference of 0.13%), Immigrants from Belize (80.5%, a difference of 0.13%), and Belizean (80.9%, a difference of 0.39%).
| Demographics | Rating | Rank | GED/Equivalency |
| Immigrants | Ecuador | 0.0 /100 | #309 | Tragic 81.0% |
| Immigrants | Guyana | 0.0 /100 | #310 | Tragic 81.0% |
| Natives/Alaskans | 0.0 /100 | #311 | Tragic 80.9% |
| Nicaraguans | 0.0 /100 | #312 | Tragic 80.9% |
| Cape Verdeans | 0.0 /100 | #313 | Tragic 80.9% |
| Belizeans | 0.0 /100 | #314 | Tragic 80.9% |
| Apache | 0.0 /100 | #315 | Tragic 80.7% |
| Central American Indians | 0.0 /100 | #316 | Tragic 80.6% |
| Immigrants | Caribbean | 0.0 /100 | #317 | Tragic 80.5% |
| Yaqui | 0.0 /100 | #318 | Tragic 80.5% |
| Immigrants | Belize | 0.0 /100 | #319 | Tragic 80.5% |
| Immigrants | Cuba | 0.0 /100 | #320 | Tragic 80.2% |
| Yup'ik | 0.0 /100 | #321 | Tragic 80.0% |
| Lumbee | 0.0 /100 | #322 | Tragic 80.0% |
| Immigrants | Nicaragua | 0.0 /100 | #323 | Tragic 79.9% |