Immigrants from Laos vs Immigrants from Europe GED/Equivalency
COMPARE
Immigrants from Laos
Immigrants from Europe
GED/Equivalency
GED/Equivalency Comparison
Immigrants from Laos
Immigrants from Europe
82.7%
GED/EQUIVALENCY
0.1/ 100
METRIC RATING
278th/ 347
METRIC RANK
87.5%
GED/EQUIVALENCY
98.1/ 100
METRIC RATING
86th/ 347
METRIC RANK
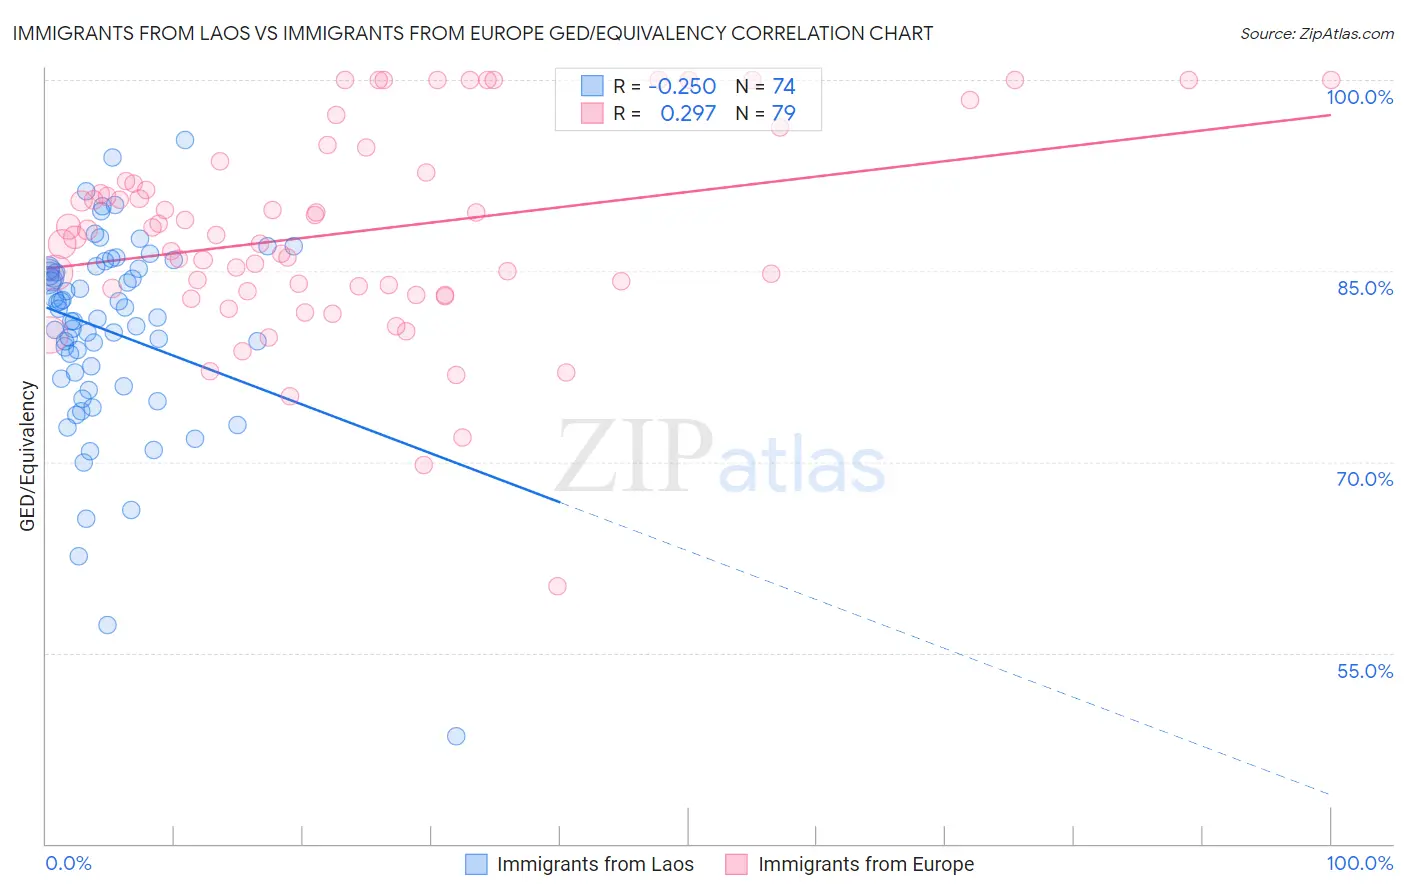
Immigrants from Laos vs Immigrants from Europe GED/Equivalency Correlation Chart
The statistical analysis conducted on geographies consisting of 201,472,886 people shows a weak negative correlation between the proportion of Immigrants from Laos and percentage of population with at least ged/equivalency education in the United States with a correlation coefficient (R) of -0.250 and weighted average of 82.7%. Similarly, the statistical analysis conducted on geographies consisting of 547,425,948 people shows a weak positive correlation between the proportion of Immigrants from Europe and percentage of population with at least ged/equivalency education in the United States with a correlation coefficient (R) of 0.297 and weighted average of 87.5%, a difference of 5.8%.
GED/Equivalency Correlation Summary
| Measurement | Immigrants from Laos | Immigrants from Europe |
| Minimum | 48.4% | 60.2% |
| Maximum | 95.3% | 100.0% |
| Range | 46.9% | 39.8% |
| Mean | 80.2% | 88.1% |
| Median | 81.3% | 87.8% |
| Interquartile 25% (IQ1) | 76.5% | 83.4% |
| Interquartile 75% (IQ3) | 85.2% | 92.7% |
| Interquartile Range (IQR) | 8.6% | 9.3% |
| Standard Deviation (Sample) | 7.9% | 8.0% |
| Standard Deviation (Population) | 7.8% | 8.0% |
Similar Demographics by GED/Equivalency
Demographics Similar to Immigrants from Laos by GED/Equivalency
In terms of ged/equivalency, the demographic groups most similar to Immigrants from Laos are Immigrants from Fiji (82.7%, a difference of 0.010%), Cheyenne (82.7%, a difference of 0.010%), Arapaho (82.8%, a difference of 0.030%), Black/African American (82.8%, a difference of 0.050%), and Seminole (82.8%, a difference of 0.070%).
| Demographics | Rating | Rank | GED/Equivalency |
| U.S. Virgin Islanders | 0.2 /100 | #271 | Tragic 82.9% |
| Barbadians | 0.1 /100 | #272 | Tragic 82.9% |
| Pennsylvania Germans | 0.1 /100 | #273 | Tragic 82.9% |
| Immigrants | Trinidad and Tobago | 0.1 /100 | #274 | Tragic 82.8% |
| Seminole | 0.1 /100 | #275 | Tragic 82.8% |
| Blacks/African Americans | 0.1 /100 | #276 | Tragic 82.8% |
| Arapaho | 0.1 /100 | #277 | Tragic 82.8% |
| Immigrants | Laos | 0.1 /100 | #278 | Tragic 82.7% |
| Immigrants | Fiji | 0.1 /100 | #279 | Tragic 82.7% |
| Cheyenne | 0.1 /100 | #280 | Tragic 82.7% |
| Sioux | 0.1 /100 | #281 | Tragic 82.6% |
| Immigrants | Immigrants | 0.1 /100 | #282 | Tragic 82.6% |
| Indonesians | 0.1 /100 | #283 | Tragic 82.5% |
| Immigrants | Barbados | 0.1 /100 | #284 | Tragic 82.4% |
| Cajuns | 0.0 /100 | #285 | Tragic 82.4% |
Demographics Similar to Immigrants from Europe by GED/Equivalency
In terms of ged/equivalency, the demographic groups most similar to Immigrants from Europe are Native Hawaiian (87.5%, a difference of 0.0%), Immigrants from Romania (87.5%, a difference of 0.010%), Dutch (87.5%, a difference of 0.010%), Immigrants from Norway (87.5%, a difference of 0.010%), and South African (87.5%, a difference of 0.050%).
| Demographics | Rating | Rank | GED/Equivalency |
| English | 98.6 /100 | #79 | Exceptional 87.6% |
| Immigrants | England | 98.5 /100 | #80 | Exceptional 87.6% |
| Immigrants | Sri Lanka | 98.3 /100 | #81 | Exceptional 87.5% |
| Romanians | 98.3 /100 | #82 | Exceptional 87.5% |
| South Africans | 98.3 /100 | #83 | Exceptional 87.5% |
| Immigrants | Romania | 98.1 /100 | #84 | Exceptional 87.5% |
| Dutch | 98.1 /100 | #85 | Exceptional 87.5% |
| Immigrants | Europe | 98.1 /100 | #86 | Exceptional 87.5% |
| Native Hawaiians | 98.1 /100 | #87 | Exceptional 87.5% |
| Immigrants | Norway | 98.1 /100 | #88 | Exceptional 87.5% |
| Hungarians | 97.9 /100 | #89 | Exceptional 87.4% |
| Welsh | 97.9 /100 | #90 | Exceptional 87.4% |
| Immigrants | Eastern Asia | 97.9 /100 | #91 | Exceptional 87.4% |
| Israelis | 97.8 /100 | #92 | Exceptional 87.4% |
| Immigrants | North Macedonia | 97.8 /100 | #93 | Exceptional 87.4% |