Immigrants from Spain vs Houma College, Under 1 year
COMPARE
Immigrants from Spain
Houma
College, Under 1 year
College, Under 1 year Comparison
Immigrants from Spain
Houma
68.4%
COLLEGE, UNDER 1 YEAR
98.5/ 100
METRIC RATING
80th/ 347
METRIC RANK
47.6%
COLLEGE, UNDER 1 YEAR
0.0/ 100
METRIC RATING
346th/ 347
METRIC RANK
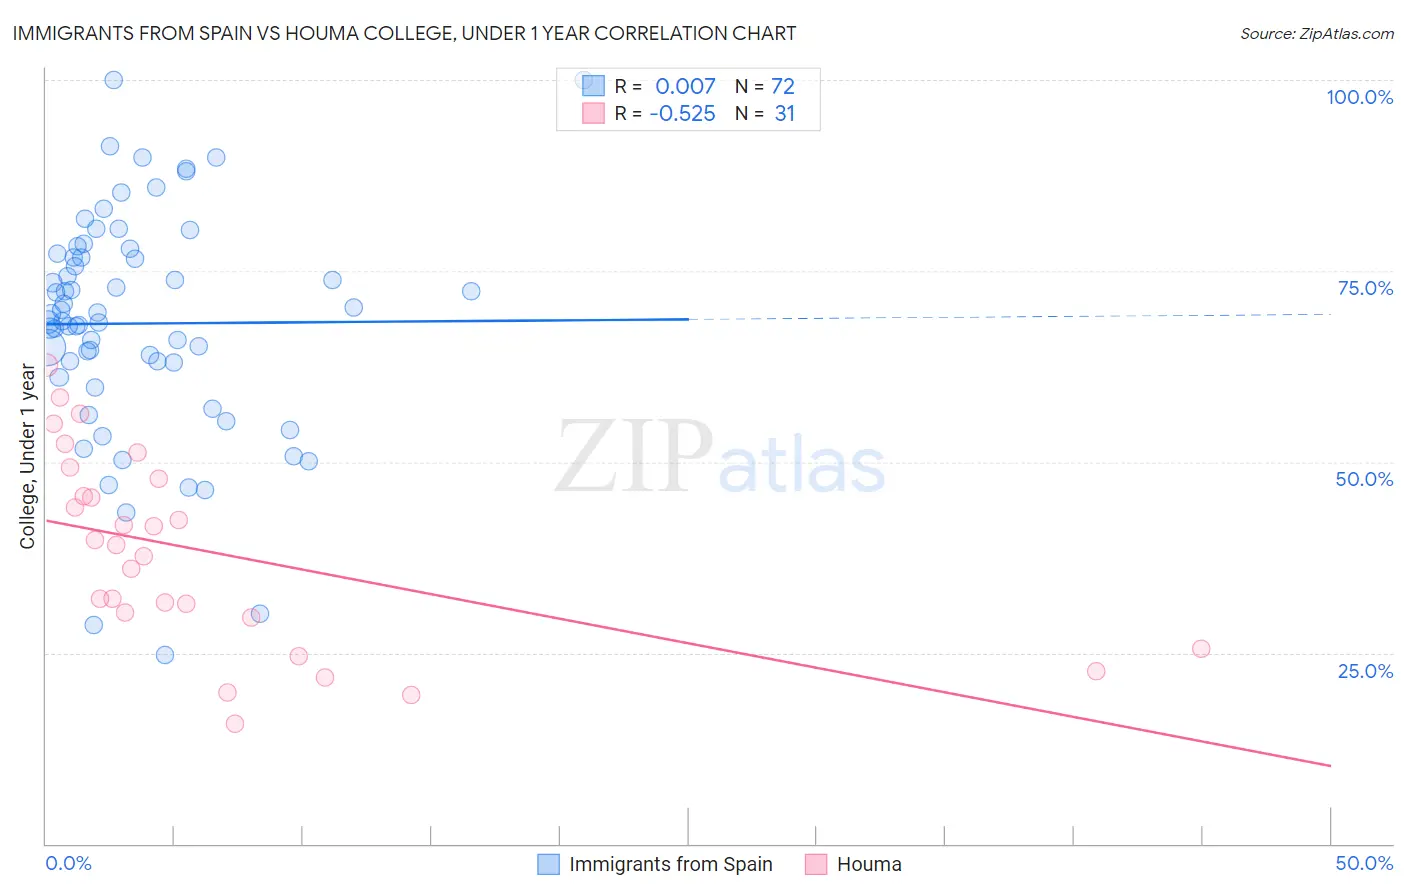
Immigrants from Spain vs Houma College, Under 1 year Correlation Chart
The statistical analysis conducted on geographies consisting of 239,683,397 people shows no correlation between the proportion of Immigrants from Spain and percentage of population with at least college, under 1 year education in the United States with a correlation coefficient (R) of 0.007 and weighted average of 68.4%. Similarly, the statistical analysis conducted on geographies consisting of 36,795,916 people shows a substantial negative correlation between the proportion of Houma and percentage of population with at least college, under 1 year education in the United States with a correlation coefficient (R) of -0.525 and weighted average of 47.6%, a difference of 43.6%.
College, Under 1 year Correlation Summary
| Measurement | Immigrants from Spain | Houma |
| Minimum | 24.8% | 15.6% |
| Maximum | 100.0% | 62.7% |
| Range | 75.2% | 47.1% |
| Mean | 68.1% | 38.1% |
| Median | 68.9% | 39.1% |
| Interquartile 25% (IQ1) | 62.0% | 29.7% |
| Interquartile 75% (IQ3) | 77.0% | 47.7% |
| Interquartile Range (IQR) | 15.0% | 18.1% |
| Standard Deviation (Sample) | 15.0% | 12.6% |
| Standard Deviation (Population) | 14.9% | 12.4% |
Similar Demographics by College, Under 1 year
Demographics Similar to Immigrants from Spain by College, Under 1 year
In terms of college, under 1 year, the demographic groups most similar to Immigrants from Spain are Greek (68.5%, a difference of 0.030%), Danish (68.5%, a difference of 0.040%), Immigrants from Greece (68.4%, a difference of 0.040%), British (68.5%, a difference of 0.050%), and Immigrants from Western Europe (68.5%, a difference of 0.090%).
| Demographics | Rating | Rank | College, Under 1 year |
| Immigrants | England | 99.0 /100 | #73 | Exceptional 68.7% |
| Swedes | 98.9 /100 | #74 | Exceptional 68.7% |
| Immigrants | Western Europe | 98.6 /100 | #75 | Exceptional 68.5% |
| Laotians | 98.6 /100 | #76 | Exceptional 68.5% |
| British | 98.6 /100 | #77 | Exceptional 68.5% |
| Danes | 98.6 /100 | #78 | Exceptional 68.5% |
| Greeks | 98.6 /100 | #79 | Exceptional 68.5% |
| Immigrants | Spain | 98.5 /100 | #80 | Exceptional 68.4% |
| Immigrants | Greece | 98.5 /100 | #81 | Exceptional 68.4% |
| Norwegians | 98.4 /100 | #82 | Exceptional 68.4% |
| Argentineans | 98.4 /100 | #83 | Exceptional 68.4% |
| Immigrants | Hungary | 98.3 /100 | #84 | Exceptional 68.3% |
| Egyptians | 98.3 /100 | #85 | Exceptional 68.3% |
| Immigrants | Lebanon | 98.3 /100 | #86 | Exceptional 68.3% |
| Chinese | 98.3 /100 | #87 | Exceptional 68.3% |
Demographics Similar to Houma by College, Under 1 year
In terms of college, under 1 year, the demographic groups most similar to Houma are Yup'ik (45.8%, a difference of 4.1%), Pima (51.4%, a difference of 7.9%), Yakama (52.6%, a difference of 10.5%), Tohono O'odham (52.8%, a difference of 10.8%), and Immigrants from Mexico (53.7%, a difference of 12.6%).
| Demographics | Rating | Rank | College, Under 1 year |
| Yuman | 0.0 /100 | #333 | Tragic 55.1% |
| Immigrants | Azores | 0.0 /100 | #334 | Tragic 54.7% |
| Inupiat | 0.0 /100 | #335 | Tragic 54.6% |
| Pennsylvania Germans | 0.0 /100 | #336 | Tragic 54.5% |
| Immigrants | Central America | 0.0 /100 | #337 | Tragic 54.4% |
| Lumbee | 0.0 /100 | #338 | Tragic 54.2% |
| Immigrants | Dominican Republic | 0.0 /100 | #339 | Tragic 54.0% |
| Spanish American Indians | 0.0 /100 | #340 | Tragic 54.0% |
| Immigrants | Cabo Verde | 0.0 /100 | #341 | Tragic 53.7% |
| Immigrants | Mexico | 0.0 /100 | #342 | Tragic 53.7% |
| Tohono O'odham | 0.0 /100 | #343 | Tragic 52.8% |
| Yakama | 0.0 /100 | #344 | Tragic 52.6% |
| Pima | 0.0 /100 | #345 | Tragic 51.4% |
| Houma | 0.0 /100 | #346 | Tragic 47.6% |
| Yup'ik | 0.0 /100 | #347 | Tragic 45.8% |