Immigrants from Greece vs Navajo College, Under 1 year
COMPARE
Immigrants from Greece
Navajo
College, Under 1 year
College, Under 1 year Comparison
Immigrants from Greece
Navajo
68.4%
COLLEGE, UNDER 1 YEAR
98.5/ 100
METRIC RATING
81st/ 347
METRIC RANK
56.3%
COLLEGE, UNDER 1 YEAR
0.0/ 100
METRIC RATING
326th/ 347
METRIC RANK
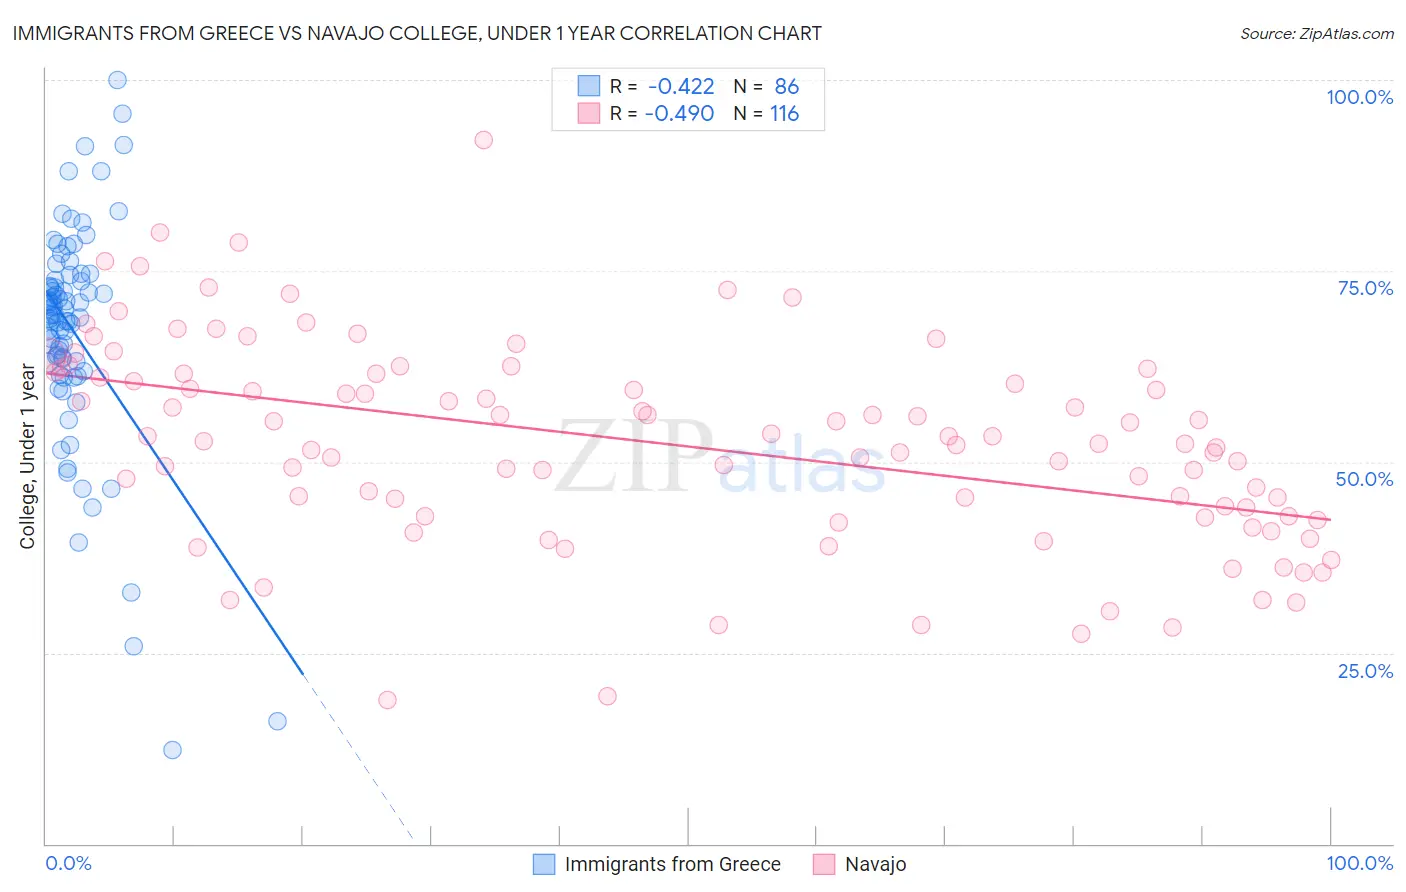
Immigrants from Greece vs Navajo College, Under 1 year Correlation Chart
The statistical analysis conducted on geographies consisting of 216,879,519 people shows a moderate negative correlation between the proportion of Immigrants from Greece and percentage of population with at least college, under 1 year education in the United States with a correlation coefficient (R) of -0.422 and weighted average of 68.4%. Similarly, the statistical analysis conducted on geographies consisting of 224,872,431 people shows a moderate negative correlation between the proportion of Navajo and percentage of population with at least college, under 1 year education in the United States with a correlation coefficient (R) of -0.490 and weighted average of 56.3%, a difference of 21.6%.
College, Under 1 year Correlation Summary
| Measurement | Immigrants from Greece | Navajo |
| Minimum | 12.4% | 18.9% |
| Maximum | 100.0% | 92.2% |
| Range | 87.6% | 73.3% |
| Mean | 67.1% | 52.4% |
| Median | 69.3% | 52.5% |
| Interquartile 25% (IQ1) | 63.1% | 42.9% |
| Interquartile 75% (IQ3) | 73.8% | 61.6% |
| Interquartile Range (IQR) | 10.7% | 18.7% |
| Standard Deviation (Sample) | 14.9% | 13.3% |
| Standard Deviation (Population) | 14.8% | 13.2% |
Similar Demographics by College, Under 1 year
Demographics Similar to Immigrants from Greece by College, Under 1 year
In terms of college, under 1 year, the demographic groups most similar to Immigrants from Greece are Immigrants from Spain (68.4%, a difference of 0.040%), Norwegian (68.4%, a difference of 0.050%), Greek (68.5%, a difference of 0.070%), Argentinean (68.4%, a difference of 0.070%), and Danish (68.5%, a difference of 0.080%).
| Demographics | Rating | Rank | College, Under 1 year |
| Swedes | 98.9 /100 | #74 | Exceptional 68.7% |
| Immigrants | Western Europe | 98.6 /100 | #75 | Exceptional 68.5% |
| Laotians | 98.6 /100 | #76 | Exceptional 68.5% |
| British | 98.6 /100 | #77 | Exceptional 68.5% |
| Danes | 98.6 /100 | #78 | Exceptional 68.5% |
| Greeks | 98.6 /100 | #79 | Exceptional 68.5% |
| Immigrants | Spain | 98.5 /100 | #80 | Exceptional 68.4% |
| Immigrants | Greece | 98.5 /100 | #81 | Exceptional 68.4% |
| Norwegians | 98.4 /100 | #82 | Exceptional 68.4% |
| Argentineans | 98.4 /100 | #83 | Exceptional 68.4% |
| Immigrants | Hungary | 98.3 /100 | #84 | Exceptional 68.3% |
| Egyptians | 98.3 /100 | #85 | Exceptional 68.3% |
| Immigrants | Lebanon | 98.3 /100 | #86 | Exceptional 68.3% |
| Chinese | 98.3 /100 | #87 | Exceptional 68.3% |
| Croatians | 98.2 /100 | #88 | Exceptional 68.3% |
Demographics Similar to Navajo by College, Under 1 year
In terms of college, under 1 year, the demographic groups most similar to Navajo are Immigrants from Guatemala (56.2%, a difference of 0.090%), Immigrants from Latin America (56.3%, a difference of 0.15%), Immigrants from El Salvador (56.4%, a difference of 0.25%), Immigrants from Honduras (56.5%, a difference of 0.38%), and Cape Verdean (56.0%, a difference of 0.38%).
| Demographics | Rating | Rank | College, Under 1 year |
| Puerto Ricans | 0.0 /100 | #319 | Tragic 56.8% |
| Guatemalans | 0.0 /100 | #320 | Tragic 56.8% |
| Natives/Alaskans | 0.0 /100 | #321 | Tragic 56.6% |
| Immigrants | Caribbean | 0.0 /100 | #322 | Tragic 56.6% |
| Immigrants | Honduras | 0.0 /100 | #323 | Tragic 56.5% |
| Immigrants | El Salvador | 0.0 /100 | #324 | Tragic 56.4% |
| Immigrants | Latin America | 0.0 /100 | #325 | Tragic 56.3% |
| Navajo | 0.0 /100 | #326 | Tragic 56.3% |
| Immigrants | Guatemala | 0.0 /100 | #327 | Tragic 56.2% |
| Cape Verdeans | 0.0 /100 | #328 | Tragic 56.0% |
| Immigrants | Cuba | 0.0 /100 | #329 | Tragic 55.7% |
| Mexicans | 0.0 /100 | #330 | Tragic 55.6% |
| Dominicans | 0.0 /100 | #331 | Tragic 55.5% |
| Immigrants | Yemen | 0.0 /100 | #332 | Tragic 55.3% |
| Yuman | 0.0 /100 | #333 | Tragic 55.1% |