Immigrants from Spain vs Immigrants from Ireland College, Under 1 year
COMPARE
Immigrants from Spain
Immigrants from Ireland
College, Under 1 year
College, Under 1 year Comparison
Immigrants from Spain
Immigrants from Ireland
68.4%
COLLEGE, UNDER 1 YEAR
98.5/ 100
METRIC RATING
80th/ 347
METRIC RANK
71.0%
COLLEGE, UNDER 1 YEAR
100.0/ 100
METRIC RATING
27th/ 347
METRIC RANK
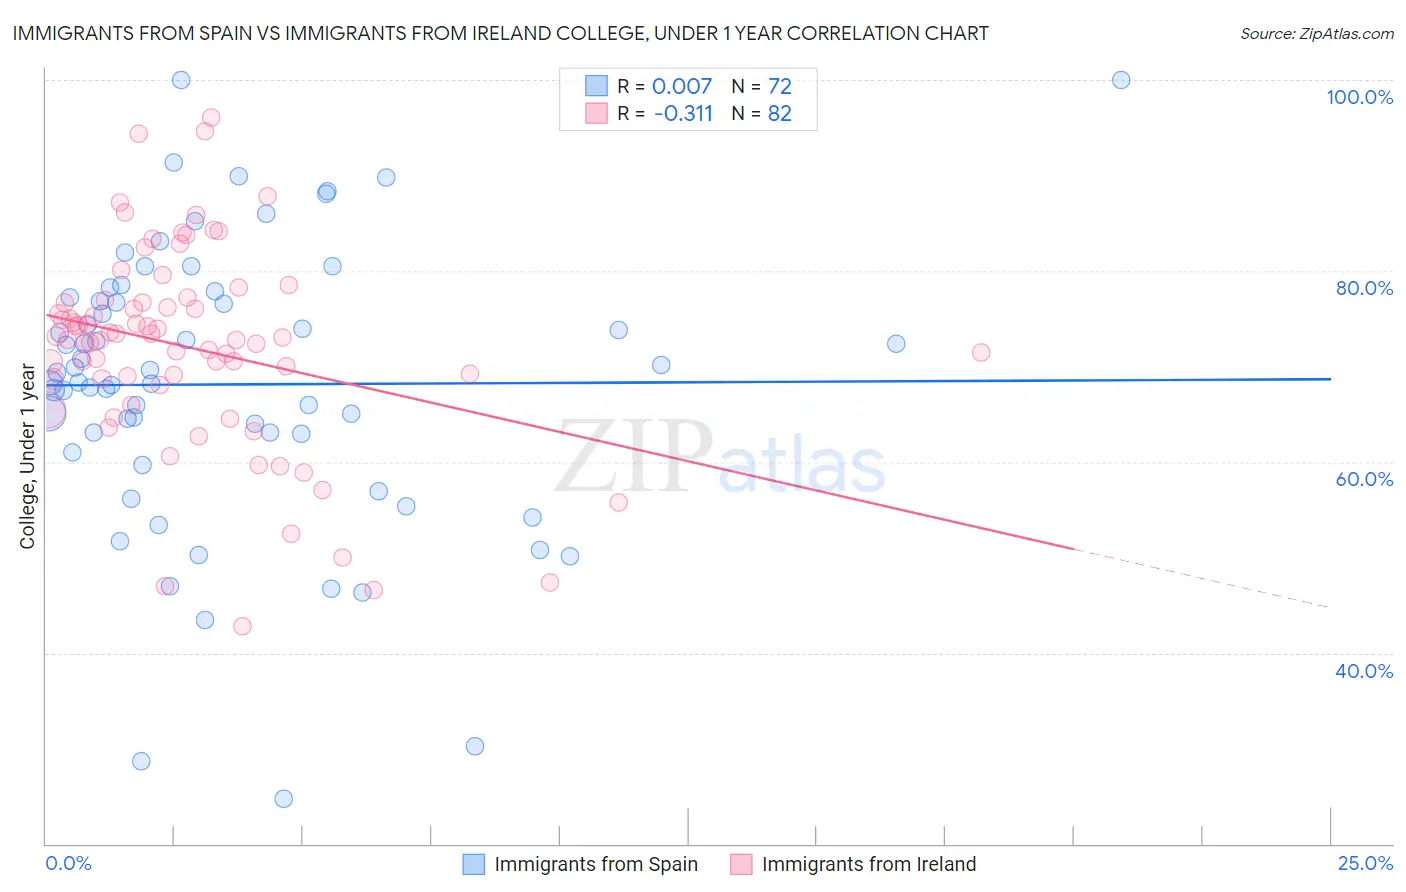
Immigrants from Spain vs Immigrants from Ireland College, Under 1 year Correlation Chart
The statistical analysis conducted on geographies consisting of 239,683,397 people shows no correlation between the proportion of Immigrants from Spain and percentage of population with at least college, under 1 year education in the United States with a correlation coefficient (R) of 0.007 and weighted average of 68.4%. Similarly, the statistical analysis conducted on geographies consisting of 240,784,591 people shows a mild negative correlation between the proportion of Immigrants from Ireland and percentage of population with at least college, under 1 year education in the United States with a correlation coefficient (R) of -0.311 and weighted average of 71.0%, a difference of 3.7%.
College, Under 1 year Correlation Summary
| Measurement | Immigrants from Spain | Immigrants from Ireland |
| Minimum | 24.8% | 42.8% |
| Maximum | 100.0% | 96.0% |
| Range | 75.2% | 53.2% |
| Mean | 68.1% | 72.0% |
| Median | 68.9% | 73.0% |
| Interquartile 25% (IQ1) | 62.0% | 68.7% |
| Interquartile 75% (IQ3) | 77.0% | 76.8% |
| Interquartile Range (IQR) | 15.0% | 8.1% |
| Standard Deviation (Sample) | 15.0% | 10.6% |
| Standard Deviation (Population) | 14.9% | 10.5% |
Similar Demographics by College, Under 1 year
Demographics Similar to Immigrants from Spain by College, Under 1 year
In terms of college, under 1 year, the demographic groups most similar to Immigrants from Spain are Greek (68.5%, a difference of 0.030%), Danish (68.5%, a difference of 0.040%), Immigrants from Greece (68.4%, a difference of 0.040%), British (68.5%, a difference of 0.050%), and Immigrants from Western Europe (68.5%, a difference of 0.090%).
| Demographics | Rating | Rank | College, Under 1 year |
| Immigrants | England | 99.0 /100 | #73 | Exceptional 68.7% |
| Swedes | 98.9 /100 | #74 | Exceptional 68.7% |
| Immigrants | Western Europe | 98.6 /100 | #75 | Exceptional 68.5% |
| Laotians | 98.6 /100 | #76 | Exceptional 68.5% |
| British | 98.6 /100 | #77 | Exceptional 68.5% |
| Danes | 98.6 /100 | #78 | Exceptional 68.5% |
| Greeks | 98.6 /100 | #79 | Exceptional 68.5% |
| Immigrants | Spain | 98.5 /100 | #80 | Exceptional 68.4% |
| Immigrants | Greece | 98.5 /100 | #81 | Exceptional 68.4% |
| Norwegians | 98.4 /100 | #82 | Exceptional 68.4% |
| Argentineans | 98.4 /100 | #83 | Exceptional 68.4% |
| Immigrants | Hungary | 98.3 /100 | #84 | Exceptional 68.3% |
| Egyptians | 98.3 /100 | #85 | Exceptional 68.3% |
| Immigrants | Lebanon | 98.3 /100 | #86 | Exceptional 68.3% |
| Chinese | 98.3 /100 | #87 | Exceptional 68.3% |
Demographics Similar to Immigrants from Ireland by College, Under 1 year
In terms of college, under 1 year, the demographic groups most similar to Immigrants from Ireland are Immigrants from Denmark (71.0%, a difference of 0.010%), Immigrants from Hong Kong (71.0%, a difference of 0.030%), Immigrants from France (71.0%, a difference of 0.030%), Bulgarian (71.1%, a difference of 0.13%), and Soviet Union (71.1%, a difference of 0.14%).
| Demographics | Rating | Rank | College, Under 1 year |
| Immigrants | Korea | 100.0 /100 | #20 | Exceptional 71.6% |
| Immigrants | Belgium | 100.0 /100 | #21 | Exceptional 71.5% |
| Immigrants | Eastern Asia | 100.0 /100 | #22 | Exceptional 71.3% |
| Immigrants | Northern Europe | 100.0 /100 | #23 | Exceptional 71.1% |
| Soviet Union | 100.0 /100 | #24 | Exceptional 71.1% |
| Bulgarians | 100.0 /100 | #25 | Exceptional 71.1% |
| Immigrants | Denmark | 100.0 /100 | #26 | Exceptional 71.0% |
| Immigrants | Ireland | 100.0 /100 | #27 | Exceptional 71.0% |
| Immigrants | Hong Kong | 100.0 /100 | #28 | Exceptional 71.0% |
| Immigrants | France | 100.0 /100 | #29 | Exceptional 71.0% |
| Immigrants | China | 99.9 /100 | #30 | Exceptional 70.9% |
| Indians (Asian) | 99.9 /100 | #31 | Exceptional 70.8% |
| Turks | 99.9 /100 | #32 | Exceptional 70.7% |
| Immigrants | South Africa | 99.9 /100 | #33 | Exceptional 70.6% |
| Estonians | 99.9 /100 | #34 | Exceptional 70.6% |