Slavic vs Navajo College, Under 1 year
COMPARE
Slavic
Navajo
College, Under 1 year
College, Under 1 year Comparison
Slavs
Navajo
66.7%
COLLEGE, UNDER 1 YEAR
85.9/ 100
METRIC RATING
140th/ 347
METRIC RANK
56.3%
COLLEGE, UNDER 1 YEAR
0.0/ 100
METRIC RATING
326th/ 347
METRIC RANK
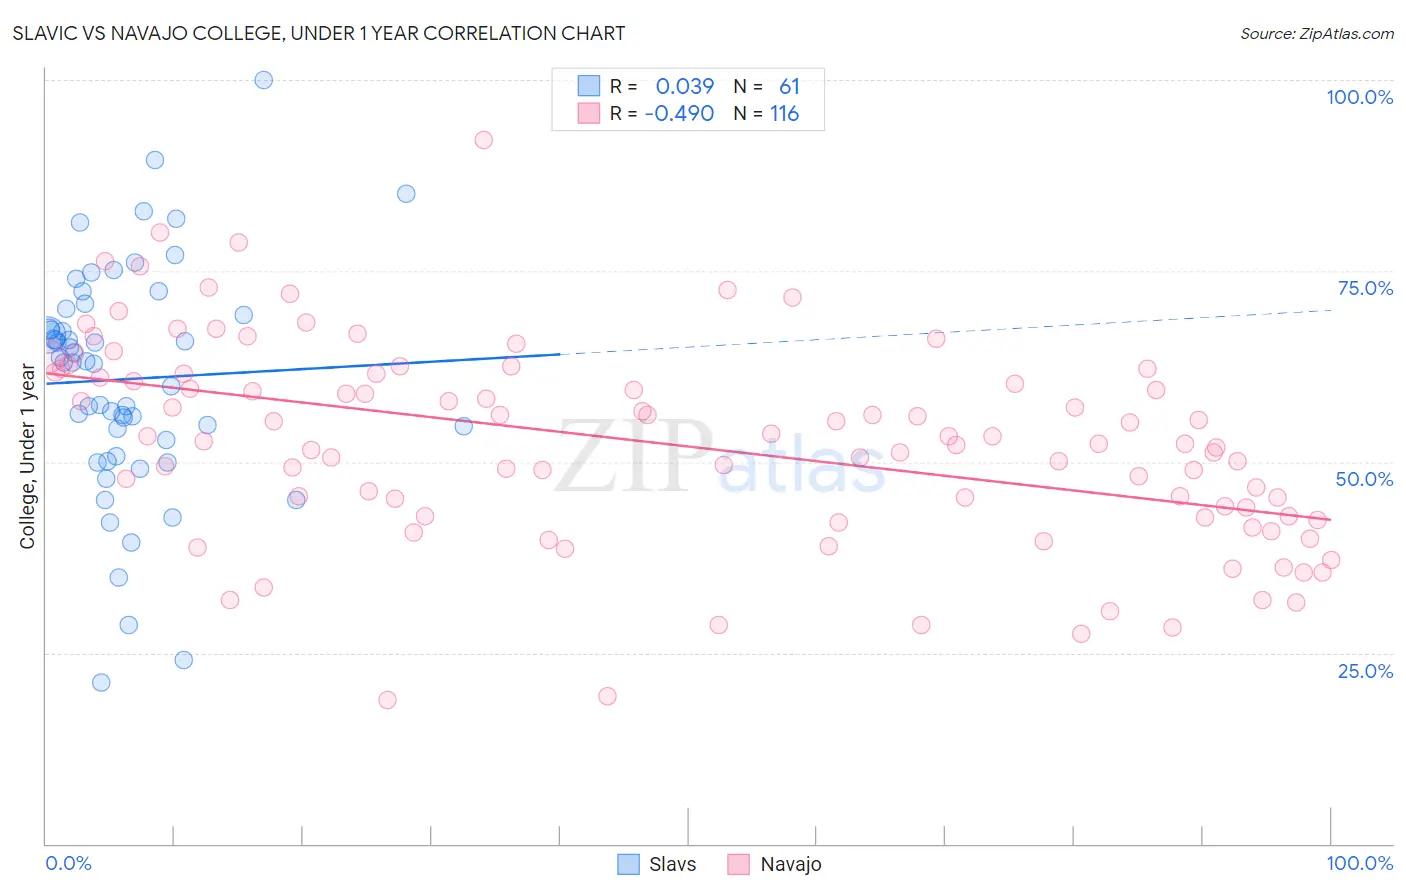
Slavic vs Navajo College, Under 1 year Correlation Chart
The statistical analysis conducted on geographies consisting of 270,867,455 people shows no correlation between the proportion of Slavs and percentage of population with at least college, under 1 year education in the United States with a correlation coefficient (R) of 0.039 and weighted average of 66.7%. Similarly, the statistical analysis conducted on geographies consisting of 224,872,431 people shows a moderate negative correlation between the proportion of Navajo and percentage of population with at least college, under 1 year education in the United States with a correlation coefficient (R) of -0.490 and weighted average of 56.3%, a difference of 18.6%.
College, Under 1 year Correlation Summary
| Measurement | Slavic | Navajo |
| Minimum | 21.0% | 18.9% |
| Maximum | 100.0% | 92.2% |
| Range | 79.0% | 73.3% |
| Mean | 60.8% | 52.4% |
| Median | 63.0% | 52.5% |
| Interquartile 25% (IQ1) | 51.8% | 42.9% |
| Interquartile 75% (IQ3) | 69.7% | 61.6% |
| Interquartile Range (IQR) | 17.9% | 18.7% |
| Standard Deviation (Sample) | 15.1% | 13.3% |
| Standard Deviation (Population) | 14.9% | 13.2% |
Similar Demographics by College, Under 1 year
Demographics Similar to Slavs by College, Under 1 year
In terms of college, under 1 year, the demographic groups most similar to Slavs are Venezuelan (66.7%, a difference of 0.0%), Immigrants from Afghanistan (66.7%, a difference of 0.070%), Immigrants from Italy (66.8%, a difference of 0.10%), Immigrants from Chile (66.8%, a difference of 0.15%), and Ugandan (66.8%, a difference of 0.18%).
| Demographics | Rating | Rank | College, Under 1 year |
| Immigrants | Brazil | 88.3 /100 | #133 | Excellent 66.9% |
| Iraqis | 88.0 /100 | #134 | Excellent 66.8% |
| Canadians | 87.9 /100 | #135 | Excellent 66.8% |
| Ugandans | 87.8 /100 | #136 | Excellent 66.8% |
| Immigrants | Chile | 87.4 /100 | #137 | Excellent 66.8% |
| Immigrants | Italy | 86.9 /100 | #138 | Excellent 66.8% |
| Venezuelans | 85.9 /100 | #139 | Excellent 66.7% |
| Slavs | 85.9 /100 | #140 | Excellent 66.7% |
| Immigrants | Afghanistan | 85.1 /100 | #141 | Excellent 66.7% |
| English | 82.9 /100 | #142 | Excellent 66.6% |
| Immigrants | Uganda | 82.8 /100 | #143 | Excellent 66.5% |
| Immigrants | Germany | 82.0 /100 | #144 | Excellent 66.5% |
| Immigrants | Kenya | 81.8 /100 | #145 | Excellent 66.5% |
| Kenyans | 81.7 /100 | #146 | Excellent 66.5% |
| Immigrants | Morocco | 81.7 /100 | #147 | Excellent 66.5% |
Demographics Similar to Navajo by College, Under 1 year
In terms of college, under 1 year, the demographic groups most similar to Navajo are Immigrants from Guatemala (56.2%, a difference of 0.090%), Immigrants from Latin America (56.3%, a difference of 0.15%), Immigrants from El Salvador (56.4%, a difference of 0.25%), Immigrants from Honduras (56.5%, a difference of 0.38%), and Cape Verdean (56.0%, a difference of 0.38%).
| Demographics | Rating | Rank | College, Under 1 year |
| Puerto Ricans | 0.0 /100 | #319 | Tragic 56.8% |
| Guatemalans | 0.0 /100 | #320 | Tragic 56.8% |
| Natives/Alaskans | 0.0 /100 | #321 | Tragic 56.6% |
| Immigrants | Caribbean | 0.0 /100 | #322 | Tragic 56.6% |
| Immigrants | Honduras | 0.0 /100 | #323 | Tragic 56.5% |
| Immigrants | El Salvador | 0.0 /100 | #324 | Tragic 56.4% |
| Immigrants | Latin America | 0.0 /100 | #325 | Tragic 56.3% |
| Navajo | 0.0 /100 | #326 | Tragic 56.3% |
| Immigrants | Guatemala | 0.0 /100 | #327 | Tragic 56.2% |
| Cape Verdeans | 0.0 /100 | #328 | Tragic 56.0% |
| Immigrants | Cuba | 0.0 /100 | #329 | Tragic 55.7% |
| Mexicans | 0.0 /100 | #330 | Tragic 55.6% |
| Dominicans | 0.0 /100 | #331 | Tragic 55.5% |
| Immigrants | Yemen | 0.0 /100 | #332 | Tragic 55.3% |
| Yuman | 0.0 /100 | #333 | Tragic 55.1% |