Immigrants from Spain vs Immigrants from Ethiopia College, Under 1 year
COMPARE
Immigrants from Spain
Immigrants from Ethiopia
College, Under 1 year
College, Under 1 year Comparison
Immigrants from Spain
Immigrants from Ethiopia
68.4%
COLLEGE, UNDER 1 YEAR
98.5/ 100
METRIC RATING
80th/ 347
METRIC RANK
68.0%
COLLEGE, UNDER 1 YEAR
97.3/ 100
METRIC RATING
97th/ 347
METRIC RANK
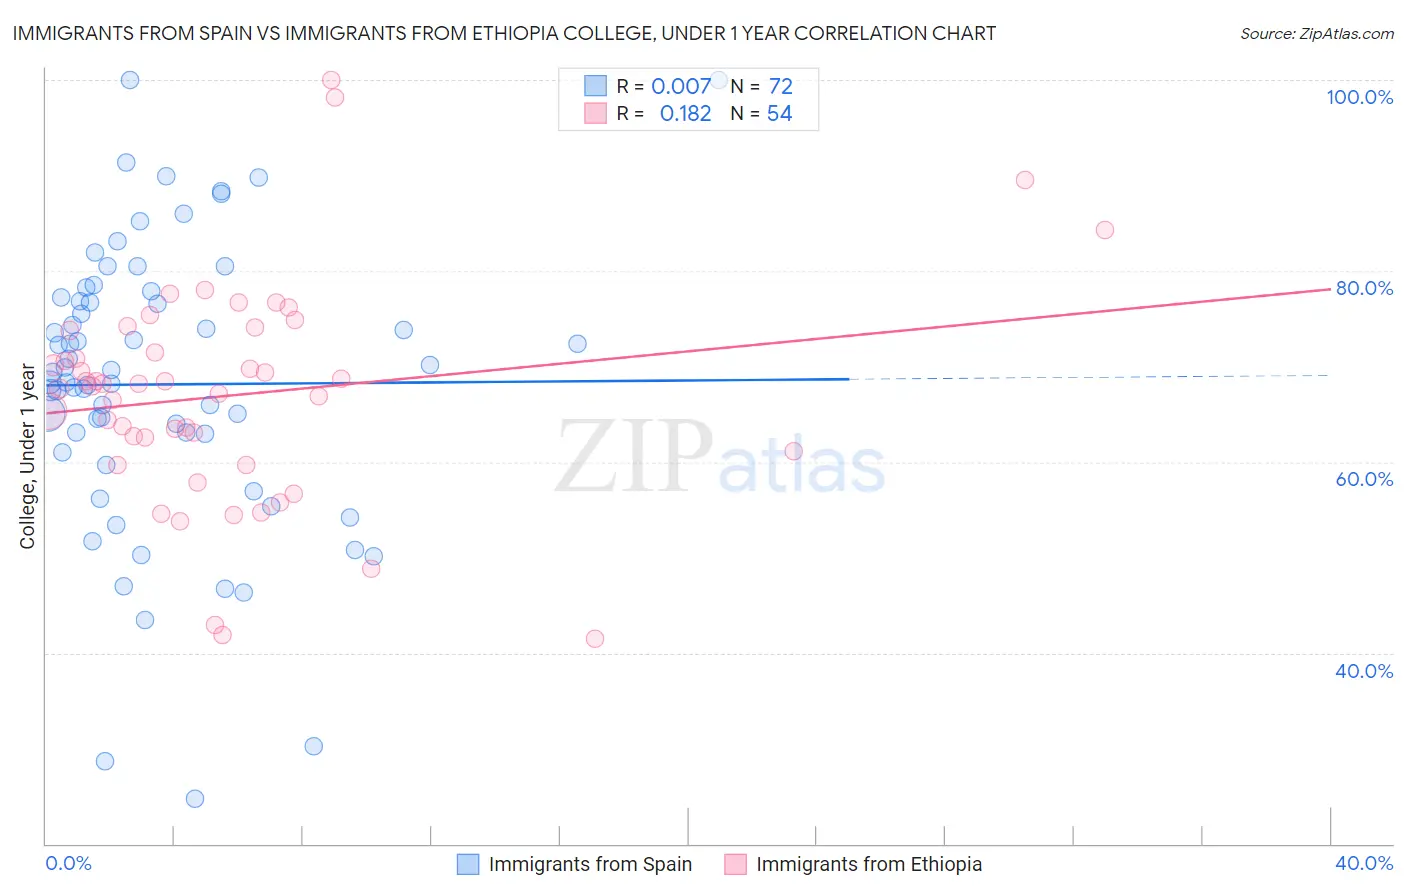
Immigrants from Spain vs Immigrants from Ethiopia College, Under 1 year Correlation Chart
The statistical analysis conducted on geographies consisting of 239,683,397 people shows no correlation between the proportion of Immigrants from Spain and percentage of population with at least college, under 1 year education in the United States with a correlation coefficient (R) of 0.007 and weighted average of 68.4%. Similarly, the statistical analysis conducted on geographies consisting of 211,551,932 people shows a poor positive correlation between the proportion of Immigrants from Ethiopia and percentage of population with at least college, under 1 year education in the United States with a correlation coefficient (R) of 0.182 and weighted average of 68.0%, a difference of 0.63%.
College, Under 1 year Correlation Summary
| Measurement | Immigrants from Spain | Immigrants from Ethiopia |
| Minimum | 24.8% | 41.4% |
| Maximum | 100.0% | 100.0% |
| Range | 75.2% | 58.6% |
| Mean | 68.1% | 67.0% |
| Median | 68.9% | 68.0% |
| Interquartile 25% (IQ1) | 62.0% | 61.1% |
| Interquartile 75% (IQ3) | 77.0% | 73.8% |
| Interquartile Range (IQR) | 15.0% | 12.6% |
| Standard Deviation (Sample) | 15.0% | 11.6% |
| Standard Deviation (Population) | 14.9% | 11.5% |
Demographics Similar to Immigrants from Spain and Immigrants from Ethiopia by College, Under 1 year
In terms of college, under 1 year, the demographic groups most similar to Immigrants from Spain are Greek (68.5%, a difference of 0.030%), Danish (68.5%, a difference of 0.040%), Immigrants from Greece (68.4%, a difference of 0.040%), Norwegian (68.4%, a difference of 0.090%), and Argentinean (68.4%, a difference of 0.11%). Similarly, the demographic groups most similar to Immigrants from Ethiopia are Jordanian (68.0%, a difference of 0.030%), Immigrants from Pakistan (68.0%, a difference of 0.060%), Paraguayan (67.9%, a difference of 0.10%), Armenian (68.1%, a difference of 0.15%), and Romanian (68.2%, a difference of 0.25%).
| Demographics | Rating | Rank | College, Under 1 year |
| Danes | 98.6 /100 | #78 | Exceptional 68.5% |
| Greeks | 98.6 /100 | #79 | Exceptional 68.5% |
| Immigrants | Spain | 98.5 /100 | #80 | Exceptional 68.4% |
| Immigrants | Greece | 98.5 /100 | #81 | Exceptional 68.4% |
| Norwegians | 98.4 /100 | #82 | Exceptional 68.4% |
| Argentineans | 98.4 /100 | #83 | Exceptional 68.4% |
| Immigrants | Hungary | 98.3 /100 | #84 | Exceptional 68.3% |
| Egyptians | 98.3 /100 | #85 | Exceptional 68.3% |
| Immigrants | Lebanon | 98.3 /100 | #86 | Exceptional 68.3% |
| Chinese | 98.3 /100 | #87 | Exceptional 68.3% |
| Croatians | 98.2 /100 | #88 | Exceptional 68.3% |
| Ethiopians | 98.2 /100 | #89 | Exceptional 68.3% |
| Icelanders | 98.1 /100 | #90 | Exceptional 68.3% |
| Europeans | 98.1 /100 | #91 | Exceptional 68.2% |
| Luxembourgers | 98.1 /100 | #92 | Exceptional 68.2% |
| Romanians | 97.9 /100 | #93 | Exceptional 68.2% |
| Armenians | 97.7 /100 | #94 | Exceptional 68.1% |
| Immigrants | Pakistan | 97.5 /100 | #95 | Exceptional 68.0% |
| Jordanians | 97.4 /100 | #96 | Exceptional 68.0% |
| Immigrants | Ethiopia | 97.3 /100 | #97 | Exceptional 68.0% |
| Paraguayans | 97.1 /100 | #98 | Exceptional 67.9% |