Immigrants from South Africa vs Immigrants from Fiji College, Under 1 year
COMPARE
Immigrants from South Africa
Immigrants from Fiji
College, Under 1 year
College, Under 1 year Comparison
Immigrants from South Africa
Immigrants from Fiji
70.6%
COLLEGE, UNDER 1 YEAR
99.9/ 100
METRIC RATING
33rd/ 347
METRIC RANK
63.4%
COLLEGE, UNDER 1 YEAR
5.7/ 100
METRIC RATING
219th/ 347
METRIC RANK
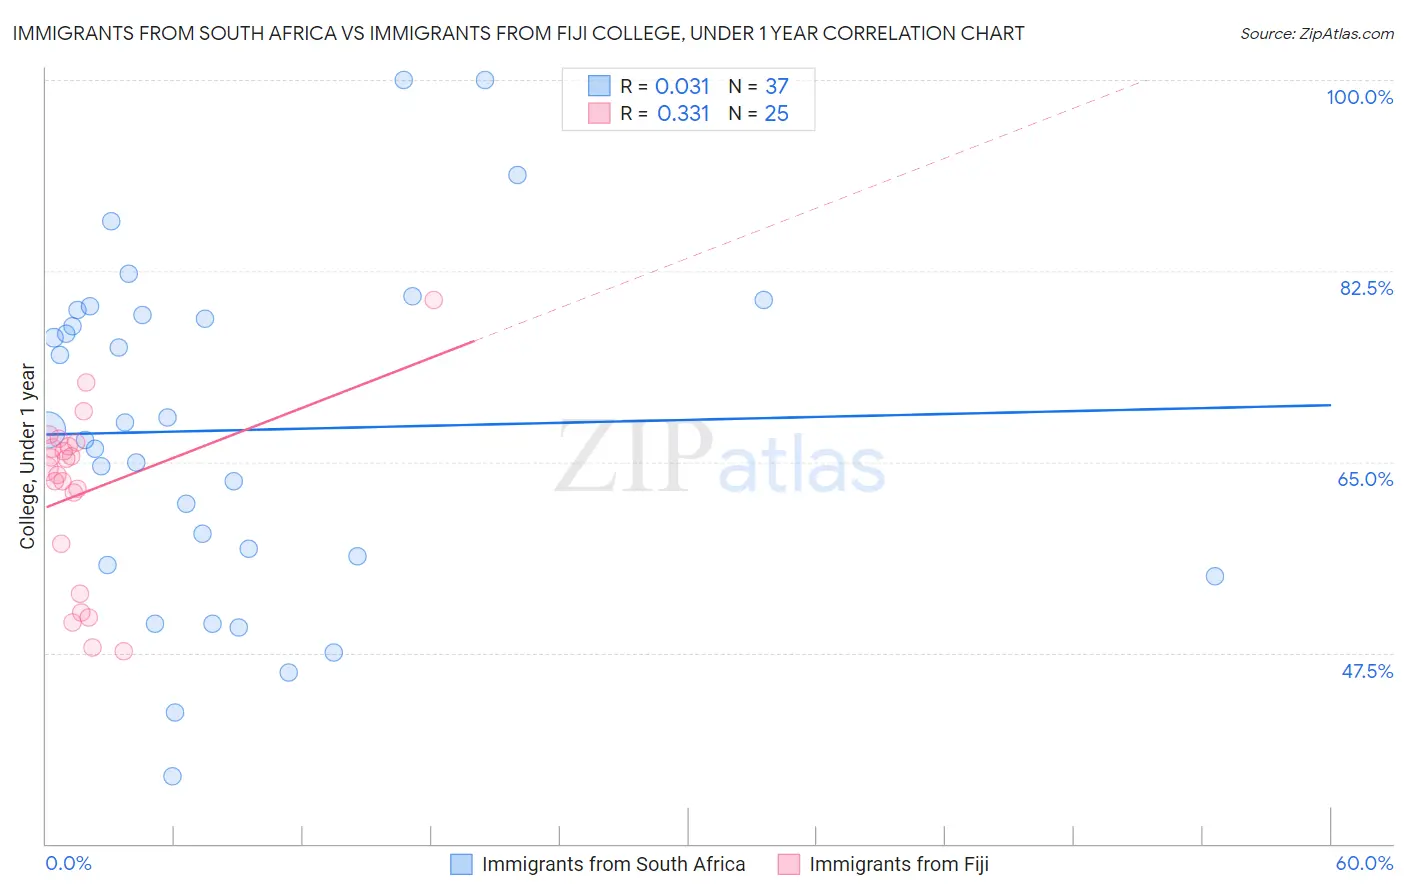
Immigrants from South Africa vs Immigrants from Fiji College, Under 1 year Correlation Chart
The statistical analysis conducted on geographies consisting of 233,321,300 people shows no correlation between the proportion of Immigrants from South Africa and percentage of population with at least college, under 1 year education in the United States with a correlation coefficient (R) of 0.031 and weighted average of 70.6%. Similarly, the statistical analysis conducted on geographies consisting of 93,755,737 people shows a mild positive correlation between the proportion of Immigrants from Fiji and percentage of population with at least college, under 1 year education in the United States with a correlation coefficient (R) of 0.331 and weighted average of 63.4%, a difference of 11.4%.
College, Under 1 year Correlation Summary
| Measurement | Immigrants from South Africa | Immigrants from Fiji |
| Minimum | 36.2% | 47.6% |
| Maximum | 100.0% | 79.8% |
| Range | 63.8% | 32.2% |
| Mean | 67.9% | 62.2% |
| Median | 68.0% | 64.3% |
| Interquartile 25% (IQ1) | 56.0% | 55.2% |
| Interquartile 75% (IQ3) | 78.7% | 66.6% |
| Interquartile Range (IQR) | 22.8% | 11.3% |
| Standard Deviation (Sample) | 15.4% | 8.0% |
| Standard Deviation (Population) | 15.2% | 7.9% |
Similar Demographics by College, Under 1 year
Demographics Similar to Immigrants from South Africa by College, Under 1 year
In terms of college, under 1 year, the demographic groups most similar to Immigrants from South Africa are Estonian (70.6%, a difference of 0.020%), Russian (70.5%, a difference of 0.10%), Immigrants from Sri Lanka (70.5%, a difference of 0.16%), Turkish (70.7%, a difference of 0.17%), and Indian (Asian) (70.8%, a difference of 0.25%).
| Demographics | Rating | Rank | College, Under 1 year |
| Immigrants | Denmark | 100.0 /100 | #26 | Exceptional 71.0% |
| Immigrants | Ireland | 100.0 /100 | #27 | Exceptional 71.0% |
| Immigrants | Hong Kong | 100.0 /100 | #28 | Exceptional 71.0% |
| Immigrants | France | 100.0 /100 | #29 | Exceptional 71.0% |
| Immigrants | China | 99.9 /100 | #30 | Exceptional 70.9% |
| Indians (Asian) | 99.9 /100 | #31 | Exceptional 70.8% |
| Turks | 99.9 /100 | #32 | Exceptional 70.7% |
| Immigrants | South Africa | 99.9 /100 | #33 | Exceptional 70.6% |
| Estonians | 99.9 /100 | #34 | Exceptional 70.6% |
| Russians | 99.9 /100 | #35 | Exceptional 70.5% |
| Immigrants | Sri Lanka | 99.9 /100 | #36 | Exceptional 70.5% |
| Immigrants | Saudi Arabia | 99.9 /100 | #37 | Exceptional 70.4% |
| Australians | 99.9 /100 | #38 | Exceptional 70.4% |
| Bhutanese | 99.9 /100 | #39 | Exceptional 70.3% |
| Immigrants | Turkey | 99.9 /100 | #40 | Exceptional 70.3% |
Demographics Similar to Immigrants from Fiji by College, Under 1 year
In terms of college, under 1 year, the demographic groups most similar to Immigrants from Fiji are Immigrants from Panama (63.4%, a difference of 0.010%), Portuguese (63.4%, a difference of 0.020%), Immigrants from Uruguay (63.4%, a difference of 0.030%), Cree (63.3%, a difference of 0.11%), and Immigrants from Senegal (63.3%, a difference of 0.16%).
| Demographics | Rating | Rank | College, Under 1 year |
| Immigrants | Middle Africa | 10.5 /100 | #212 | Poor 63.9% |
| Immigrants | South America | 9.1 /100 | #213 | Tragic 63.8% |
| Immigrants | Nigeria | 8.8 /100 | #214 | Tragic 63.7% |
| Senegalese | 7.7 /100 | #215 | Tragic 63.6% |
| Hmong | 6.8 /100 | #216 | Tragic 63.5% |
| Immigrants | Uruguay | 5.8 /100 | #217 | Tragic 63.4% |
| Immigrants | Panama | 5.7 /100 | #218 | Tragic 63.4% |
| Immigrants | Fiji | 5.7 /100 | #219 | Tragic 63.4% |
| Portuguese | 5.6 /100 | #220 | Tragic 63.4% |
| Cree | 5.2 /100 | #221 | Tragic 63.3% |
| Immigrants | Senegal | 5.0 /100 | #222 | Tragic 63.3% |
| Immigrants | Costa Rica | 4.5 /100 | #223 | Tragic 63.2% |
| Sub-Saharan Africans | 4.4 /100 | #224 | Tragic 63.2% |
| Immigrants | Peru | 4.0 /100 | #225 | Tragic 63.1% |
| Immigrants | Colombia | 4.0 /100 | #226 | Tragic 63.1% |