Immigrants from South Africa vs Potawatomi Child Poverty Under the Age of 5

COMPARE

Immigrants from South Africa
Race
Ancestry
AfghanAfricanAlaska NativeAlaskan AthabascanAlbanianAleutAlsatianAmericanApacheArabArapahoArgentineanArmenianAssyrian/Chaldean/SyriacAustralianAustrianBahamianBangladeshiBarbadianBasqueBelgianBelizeanBermudanBhutaneseBlackfeetBolivianBrazilianBritishBritish West IndianBulgarianBurmeseCajunCambodianCanadianCape VerdeanCarpatho RusynCelticCentral AmericanCentral American IndianCherokeeCheyenneChickasawChileanChineseChippewaChoctawColombianColvilleComancheCosta RicanCreeCreekCroatianCrowCubanCypriotCzechCzechoslovakianDanishDelawareDominicanDutchDutch West IndianEastern EuropeanEcuadorianEgyptianEnglishEstonianEthiopianEuropeanFijianFilipinoFinnishFrenchFrench American IndianFrench CanadianGermanGerman RussianGhanaianGreekGuamanian/ChamorroGuatemalanGuyaneseHaitianHmongHonduranHopiHoumaHungarianIcelanderIndian (Asian)IndonesianInupiatIranianIraqiIrishIroquoisIsraeliItalianJamaicanJapaneseJordanianKenyanKiowaKoreanLaotianLatvianLebaneseLiberianLithuanianLumbeeLuxembourgerMacedonianMalaysianMalteseMarshalleseMenomineeMexicanMexican American IndianMongolianMoroccanNative HawaiianNavajoNepaleseNew ZealanderNicaraguanNigerianNorthern EuropeanNorwegianOkinawanOsageOttawaPaiutePakistaniPalestinianPanamanianParaguayanPennsylvania GermanPeruvianPimaPolishPortuguesePuebloPuerto RicanPuget Sound SalishRomanianRussianSalvadoranSamoanScandinavianScotch-IrishScottishSeminoleSenegaleseSerbianShoshoneSierra LeoneanSiouxSlavicSlovakSloveneSomaliSouth AfricanSouth AmericanSouth American IndianSoviet UnionSpaniardSpanishSpanish AmericanSpanish American IndianSri LankanSubsaharan AfricanSudaneseSwedishSwissSyrianTaiwaneseThaiTlingit-HaidaTohono O'OdhamTonganTrinidadian and TobagonianTsimshianTurkishU.S. Virgin IslanderUgandanUkrainianUruguayanUteVenezuelanVietnameseWelshWest IndianYakamaYaquiYugoslavianYumanYup'ikZimbabwean
Immigration
NonimmigrantsImmigrantsAfghanistanAfricaAlbaniaArgentinaArmeniaAsiaAustraliaAustriaBahamasBangladeshBarbadosBelarusBelgiumBelizeBoliviaBosnia and HerzegovinaBrazilBulgariaBurma/MyanmarCabo VerdeCambodiaCameroonCanadaCaribbeanCentral AmericaChileChinaColombiaCongoCosta RicaCroatiaCubaCzechoslovakiaDenmarkDominicaDominican RepublicEastern AfricaEastern AsiaEastern EuropeEcuadorEgyptEl SalvadorEnglandEritreaEthiopiaEuropeFijiFranceGermanyGhanaGreeceGrenadaGuatemalaGuyanaHaitiHondurasHong KongHungaryIndiaIndonesiaIranIraqIrelandIsraelItalyJamaicaJapanJordanKazakhstanKenyaKoreaKuwaitLaosLatin AmericaLatviaLebanonLiberiaLithuaniaMalaysiaMexicoMicronesiaMiddle AfricaMoldovaMoroccoNepalNetherlandsNicaraguaNigeriaNorth AmericaNorth MacedoniaNorthern AfricaNorthern EuropeNorwayOceaniaPakistanPanamaPeruPhilippinesPolandPortugalRomaniaRussiaSaudi ArabiaScotlandSenegalSerbiaSierra LeoneSingaporeSomaliaSouth AfricaSouth AmericaSouth Central AsiaSouth Eastern AsiaSouthern EuropeSpainSri LankaSt. Vincent and the GrenadinesSudanSwedenSwitzerlandSyriaTaiwanThailandTrinidad and TobagoTurkeyUgandaUkraineUruguayUzbekistanVenezuelaVietnamWest IndiesWestern AfricaWestern AsiaWestern EuropeYemenZaireZimbabweAzores
Potawatomi
Race
Ancestry
AfghanAfricanAlaska NativeAlaskan AthabascanAlbanianAleutAlsatianAmericanApacheArabArapahoArgentineanArmenianAssyrian/Chaldean/SyriacAustralianAustrianBahamianBangladeshiBarbadianBasqueBelgianBelizeanBermudanBhutaneseBlackfeetBolivianBrazilianBritishBritish West IndianBulgarianBurmeseCajunCambodianCanadianCape VerdeanCarpatho RusynCelticCentral AmericanCentral American IndianCherokeeCheyenneChickasawChileanChineseChippewaChoctawColombianColvilleComancheCosta RicanCreeCreekCroatianCrowCubanCypriotCzechCzechoslovakianDanishDelawareDominicanDutchDutch West IndianEastern EuropeanEcuadorianEgyptianEnglishEstonianEthiopianEuropeanFijianFilipinoFinnishFrenchFrench American IndianFrench CanadianGermanGerman RussianGhanaianGreekGuamanian/ChamorroGuatemalanGuyaneseHaitianHmongHonduranHopiHoumaHungarianIcelanderIndian (Asian)IndonesianInupiatIranianIraqiIrishIroquoisIsraeliItalianJamaicanJapaneseJordanianKenyanKiowaKoreanLaotianLatvianLebaneseLiberianLithuanianLumbeeLuxembourgerMacedonianMalaysianMalteseMarshalleseMenomineeMexicanMexican American IndianMongolianMoroccanNative HawaiianNavajoNepaleseNew ZealanderNicaraguanNigerianNorthern EuropeanNorwegianOkinawanOsageOttawaPaiutePakistaniPalestinianPanamanianParaguayanPennsylvania GermanPeruvianPimaPolishPortuguesePotawatomiPuebloPuerto RicanPuget Sound SalishRomanianRussianSalvadoranSamoanScandinavianScotch-IrishScottishSeminoleSenegaleseSerbianShoshoneSierra LeoneanSiouxSlavicSlovakSloveneSomaliSouth AfricanSouth AmericanSouth American IndianSoviet UnionSpaniardSpanishSpanish AmericanSpanish American IndianSri LankanSubsaharan AfricanSudaneseSwedishSwissSyrianTaiwaneseThaiTlingit-HaidaTohono O'OdhamTonganTrinidadian and TobagonianTsimshianTurkishU.S. Virgin IslanderUgandanUkrainianUruguayanUteVenezuelanVietnameseWelshWest IndianYakamaYaquiYugoslavianYumanYup'ikZimbabwean
Immigration
NonimmigrantsImmigrantsAfghanistanAfricaAlbaniaArgentinaArmeniaAsiaAustraliaAustriaBahamasBangladeshBarbadosBelarusBelgiumBelizeBoliviaBosnia and HerzegovinaBrazilBulgariaBurma/MyanmarCabo VerdeCambodiaCameroonCanadaCaribbeanCentral AmericaChileChinaColombiaCongoCosta RicaCroatiaCubaCzechoslovakiaDenmarkDominicaDominican RepublicEastern AfricaEastern AsiaEastern EuropeEcuadorEgyptEl SalvadorEnglandEritreaEthiopiaEuropeFijiFranceGermanyGhanaGreeceGrenadaGuatemalaGuyanaHaitiHondurasHong KongHungaryIndiaIndonesiaIranIraqIrelandIsraelItalyJamaicaJapanJordanKazakhstanKenyaKoreaKuwaitLaosLatin AmericaLatviaLebanonLiberiaLithuaniaMalaysiaMexicoMicronesiaMiddle AfricaMoldovaMoroccoNepalNetherlandsNicaraguaNigeriaNorth AmericaNorth MacedoniaNorthern AfricaNorthern EuropeNorwayOceaniaPakistanPanamaPeruPhilippinesPolandPortugalRomaniaRussiaSaudi ArabiaScotlandSenegalSerbiaSierra LeoneSingaporeSomaliaSouth AmericaSouth Central AsiaSouth Eastern AsiaSouthern EuropeSpainSri LankaSt. Vincent and the GrenadinesSudanSwedenSwitzerlandSyriaTaiwanThailandTrinidad and TobagoTurkeyUgandaUkraineUruguayUzbekistanVenezuelaVietnamWest IndiesWestern AfricaWestern AsiaWestern EuropeYemenZaireZimbabweAzores
Child Poverty Under the Age of 5
Income
Poverty
Unemployment
Labor Participation
Family Structure
Vehicle Availability
Education Level
Disability

Child Poverty Under the Age of 5 Comparison

Immigrants from South Africa

Potawatomi

Exceptional
Tragic
15.8%
CHILD POVERTY UNDER THE AGE OF 5
96.1/ 100
METRIC RATING
98th/ 347
METRIC RANK
21.0%
CHILD POVERTY UNDER THE AGE OF 5
0.0/ 100
METRIC RATING
282nd/ 347
METRIC RANK

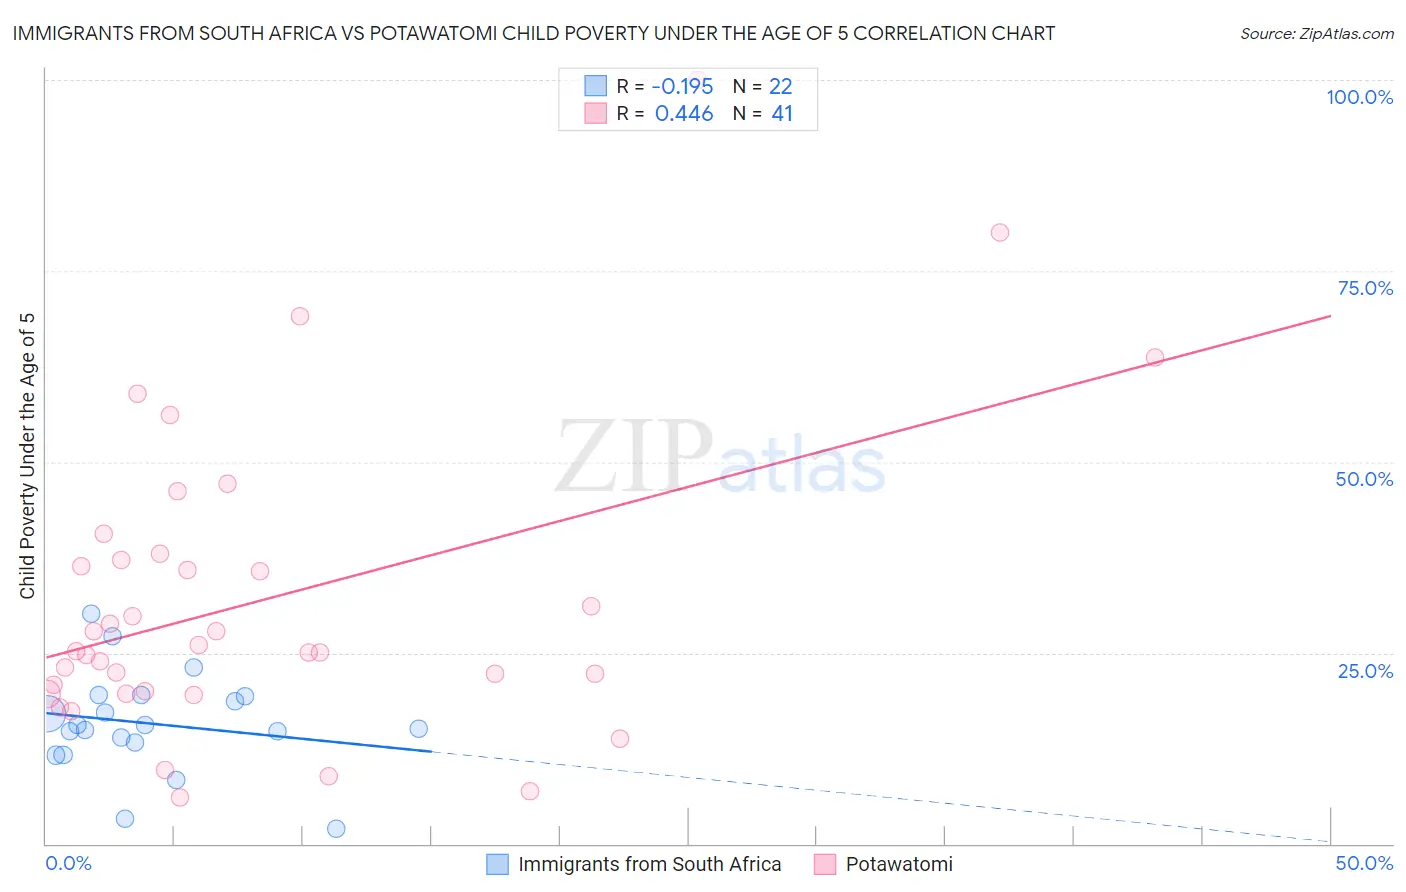
Immigrants from South Africa vs Potawatomi Child Poverty Under the Age of 5 Correlation Chart

The statistical analysis conducted on geographies consisting of 224,707,543 people shows a poor negative correlation between the proportion of Immigrants from South Africa and poverty level among children under the age of 5 in the United States with a correlation coefficient (R) of -0.195 and weighted average of 15.8%. Similarly, the statistical analysis conducted on geographies consisting of 116,008,403 people shows a moderate positive correlation between the proportion of Potawatomi and poverty level among children under the age of 5 in the United States with a correlation coefficient (R) of 0.446 and weighted average of 21.0%, a difference of 32.9%.
Immigrants from South Africa vs Potawatomi Child Poverty Under the Age of 5

Child Poverty Under the Age of 5 Correlation Summary

MeasurementImmigrants from South AfricaPotawatomi
Minimum1.9%6.1%
Maximum30.2%100.0%
Range28.3%93.9%
Mean15.7%31.9%
Median15.2%25.1%
Interquartile 25% (IQ1)13.2%19.8%
Interquartile 75% (IQ3)19.3%37.6%
Interquartile Range (IQR)6.1%17.8%
Standard Deviation (Sample)6.5%19.8%
Standard Deviation (Population)6.4%19.6%

Similar Demographics by Child Poverty Under the Age of 5

Demographics Similar to Immigrants from South Africa by Child Poverty Under the Age of 5

In terms of child poverty under the age of 5, the demographic groups most similar to Immigrants from South Africa are Macedonian (15.8%, a difference of 0.070%), Immigrants from Kazakhstan (15.8%, a difference of 0.11%), Palestinian (15.8%, a difference of 0.11%), Immigrants from Canada (15.8%, a difference of 0.13%), and Immigrants from Zimbabwe (15.8%, a difference of 0.13%).
DemographicsRating | RankChild Poverty Under the Age of 5
Poles
97.2
/100
|
#91
Exceptional
15.7%
Scandinavians
97.1
/100
|
#92
Exceptional
15.7%
Ukrainians
97.1
/100
|
#93
Exceptional
15.7%
Immigrants | South Eastern Asia
97.1
/100
|
#94
Exceptional
15.7%
Immigrants | Switzerland
96.4
/100
|
#95
Exceptional
15.8%
Immigrants | Kazakhstan
96.2
/100
|
#96
Exceptional
15.8%
Macedonians
96.2
/100
|
#97
Exceptional
15.8%
Immigrants | South Africa
96.1
/100
|
#98
Exceptional
15.8%
Palestinians
95.9
/100
|
#99
Exceptional
15.8%
Immigrants | Canada
95.9
/100
|
#100
Exceptional
15.8%
Immigrants | Zimbabwe
95.9
/100
|
#101
Exceptional
15.8%
Armenians
95.7
/100
|
#102
Exceptional
15.8%
Europeans
95.3
/100
|
#103
Exceptional
15.9%
Immigrants | North America
94.9
/100
|
#104
Exceptional
15.9%
Immigrants | Spain
94.8
/100
|
#105
Exceptional
15.9%

Demographics Similar to Potawatomi by Child Poverty Under the Age of 5

In terms of child poverty under the age of 5, the demographic groups most similar to Potawatomi are Comanche (21.0%, a difference of 0.20%), Somali (21.1%, a difference of 0.53%), Senegalese (20.9%, a difference of 0.54%), French American Indian (20.8%, a difference of 0.77%), and Haitian (21.2%, a difference of 1.0%).
DemographicsRating | RankChild Poverty Under the Age of 5
Bangladeshis
0.1
/100
|
#275
Tragic
20.6%
West Indians
0.0
/100
|
#276
Tragic
20.6%
Immigrants | West Indies
0.0
/100
|
#277
Tragic
20.7%
Immigrants | Grenada
0.0
/100
|
#278
Tragic
20.7%
Sub-Saharan Africans
0.0
/100
|
#279
Tragic
20.8%
French American Indians
0.0
/100
|
#280
Tragic
20.8%
Senegalese
0.0
/100
|
#281
Tragic
20.9%
Potawatomi
0.0
/100
|
#282
Tragic
21.0%
Comanche
0.0
/100
|
#283
Tragic
21.0%
Somalis
0.0
/100
|
#284
Tragic
21.1%
Haitians
0.0
/100
|
#285
Tragic
21.2%
Immigrants | Latin America
0.0
/100
|
#286
Tragic
21.2%
Immigrants | Zaire
0.0
/100
|
#287
Tragic
21.3%
Immigrants | Senegal
0.0
/100
|
#288
Tragic
21.3%
Immigrants | Haiti
0.0
/100
|
#289
Tragic
21.3%