Immigrants from South Africa vs Immigrants from Nicaragua College, Under 1 year
COMPARE
Immigrants from South Africa
Immigrants from Nicaragua
College, Under 1 year
College, Under 1 year Comparison
Immigrants from South Africa
Immigrants from Nicaragua
70.6%
COLLEGE, UNDER 1 YEAR
99.9/ 100
METRIC RATING
33rd/ 347
METRIC RANK
57.6%
COLLEGE, UNDER 1 YEAR
0.0/ 100
METRIC RATING
309th/ 347
METRIC RANK
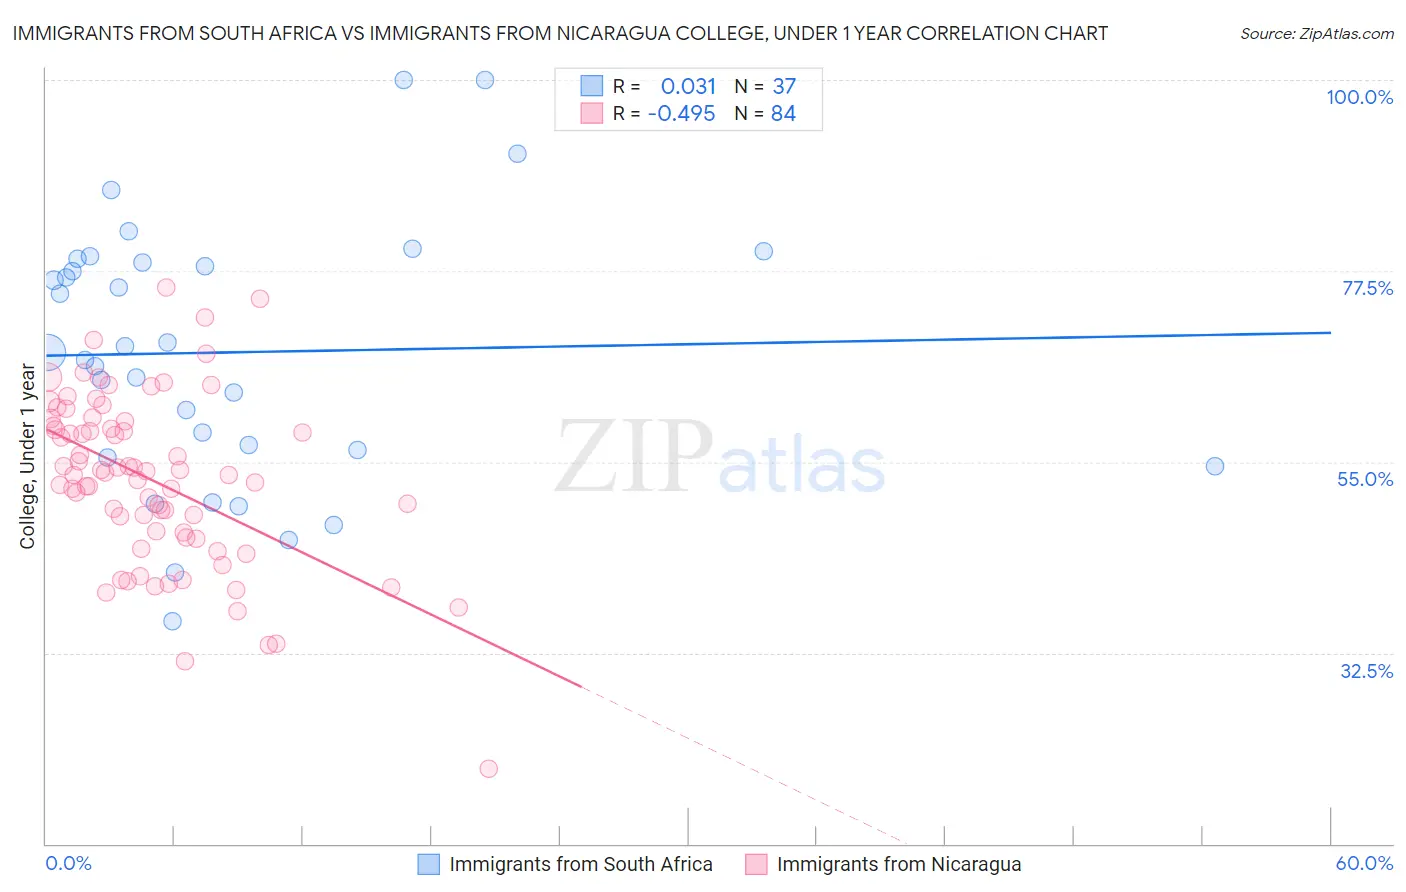
Immigrants from South Africa vs Immigrants from Nicaragua College, Under 1 year Correlation Chart
The statistical analysis conducted on geographies consisting of 233,321,300 people shows no correlation between the proportion of Immigrants from South Africa and percentage of population with at least college, under 1 year education in the United States with a correlation coefficient (R) of 0.031 and weighted average of 70.6%. Similarly, the statistical analysis conducted on geographies consisting of 236,341,850 people shows a moderate negative correlation between the proportion of Immigrants from Nicaragua and percentage of population with at least college, under 1 year education in the United States with a correlation coefficient (R) of -0.495 and weighted average of 57.6%, a difference of 22.6%.
College, Under 1 year Correlation Summary
| Measurement | Immigrants from South Africa | Immigrants from Nicaragua |
| Minimum | 36.2% | 18.9% |
| Maximum | 100.0% | 75.6% |
| Range | 63.8% | 56.7% |
| Mean | 67.9% | 52.8% |
| Median | 68.0% | 53.6% |
| Interquartile 25% (IQ1) | 56.0% | 46.4% |
| Interquartile 75% (IQ3) | 78.7% | 59.5% |
| Interquartile Range (IQR) | 22.8% | 13.2% |
| Standard Deviation (Sample) | 15.4% | 10.2% |
| Standard Deviation (Population) | 15.2% | 10.1% |
Similar Demographics by College, Under 1 year
Demographics Similar to Immigrants from South Africa by College, Under 1 year
In terms of college, under 1 year, the demographic groups most similar to Immigrants from South Africa are Estonian (70.6%, a difference of 0.020%), Russian (70.5%, a difference of 0.10%), Immigrants from Sri Lanka (70.5%, a difference of 0.16%), Turkish (70.7%, a difference of 0.17%), and Indian (Asian) (70.8%, a difference of 0.25%).
| Demographics | Rating | Rank | College, Under 1 year |
| Immigrants | Denmark | 100.0 /100 | #26 | Exceptional 71.0% |
| Immigrants | Ireland | 100.0 /100 | #27 | Exceptional 71.0% |
| Immigrants | Hong Kong | 100.0 /100 | #28 | Exceptional 71.0% |
| Immigrants | France | 100.0 /100 | #29 | Exceptional 71.0% |
| Immigrants | China | 99.9 /100 | #30 | Exceptional 70.9% |
| Indians (Asian) | 99.9 /100 | #31 | Exceptional 70.8% |
| Turks | 99.9 /100 | #32 | Exceptional 70.7% |
| Immigrants | South Africa | 99.9 /100 | #33 | Exceptional 70.6% |
| Estonians | 99.9 /100 | #34 | Exceptional 70.6% |
| Russians | 99.9 /100 | #35 | Exceptional 70.5% |
| Immigrants | Sri Lanka | 99.9 /100 | #36 | Exceptional 70.5% |
| Immigrants | Saudi Arabia | 99.9 /100 | #37 | Exceptional 70.4% |
| Australians | 99.9 /100 | #38 | Exceptional 70.4% |
| Bhutanese | 99.9 /100 | #39 | Exceptional 70.3% |
| Immigrants | Turkey | 99.9 /100 | #40 | Exceptional 70.3% |
Demographics Similar to Immigrants from Nicaragua by College, Under 1 year
In terms of college, under 1 year, the demographic groups most similar to Immigrants from Nicaragua are Fijian (57.7%, a difference of 0.12%), Central American (57.7%, a difference of 0.12%), Immigrants from Portugal (57.7%, a difference of 0.14%), Haitian (57.8%, a difference of 0.33%), and Pueblo (57.4%, a difference of 0.39%).
| Demographics | Rating | Rank | College, Under 1 year |
| Apache | 0.0 /100 | #302 | Tragic 58.0% |
| Immigrants | Dominica | 0.0 /100 | #303 | Tragic 57.9% |
| Kiowa | 0.0 /100 | #304 | Tragic 57.8% |
| Haitians | 0.0 /100 | #305 | Tragic 57.8% |
| Immigrants | Portugal | 0.0 /100 | #306 | Tragic 57.7% |
| Fijians | 0.0 /100 | #307 | Tragic 57.7% |
| Central Americans | 0.0 /100 | #308 | Tragic 57.7% |
| Immigrants | Nicaragua | 0.0 /100 | #309 | Tragic 57.6% |
| Pueblo | 0.0 /100 | #310 | Tragic 57.4% |
| Cajuns | 0.0 /100 | #311 | Tragic 57.3% |
| Salvadorans | 0.0 /100 | #312 | Tragic 57.3% |
| Dutch West Indians | 0.0 /100 | #313 | Tragic 57.2% |
| Hopi | 0.0 /100 | #314 | Tragic 57.1% |
| Hondurans | 0.0 /100 | #315 | Tragic 57.1% |
| Menominee | 0.0 /100 | #316 | Tragic 57.0% |