Immigrants from South Africa vs Lumbee College, Under 1 year
COMPARE
Immigrants from South Africa
Lumbee
College, Under 1 year
College, Under 1 year Comparison
Immigrants from South Africa
Lumbee
70.6%
COLLEGE, UNDER 1 YEAR
99.9/ 100
METRIC RATING
33rd/ 347
METRIC RANK
54.2%
COLLEGE, UNDER 1 YEAR
0.0/ 100
METRIC RATING
338th/ 347
METRIC RANK
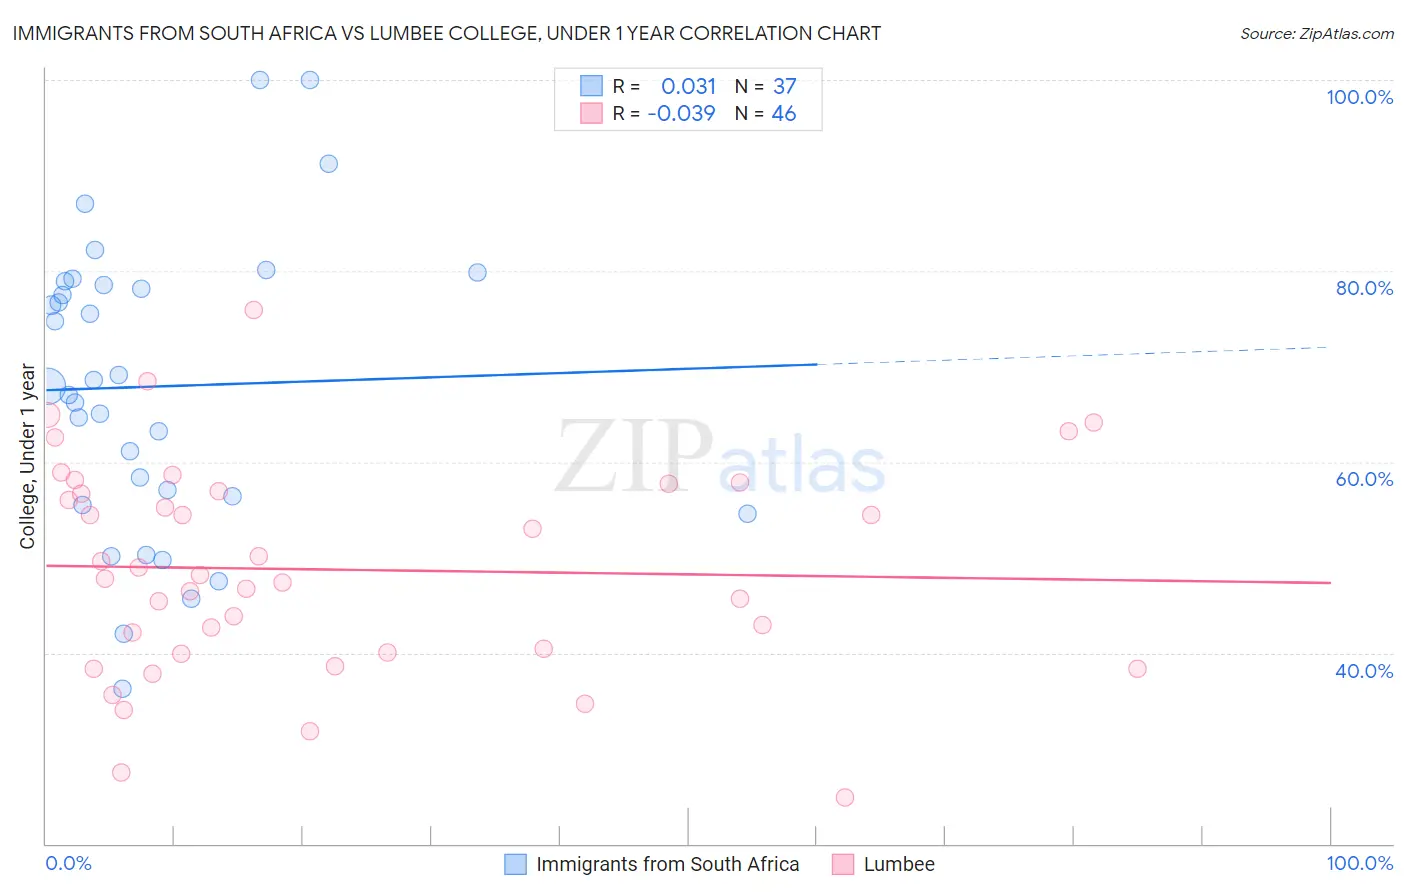
Immigrants from South Africa vs Lumbee College, Under 1 year Correlation Chart
The statistical analysis conducted on geographies consisting of 233,321,300 people shows no correlation between the proportion of Immigrants from South Africa and percentage of population with at least college, under 1 year education in the United States with a correlation coefficient (R) of 0.031 and weighted average of 70.6%. Similarly, the statistical analysis conducted on geographies consisting of 92,299,068 people shows no correlation between the proportion of Lumbee and percentage of population with at least college, under 1 year education in the United States with a correlation coefficient (R) of -0.039 and weighted average of 54.2%, a difference of 30.2%.
College, Under 1 year Correlation Summary
| Measurement | Immigrants from South Africa | Lumbee |
| Minimum | 36.2% | 24.8% |
| Maximum | 100.0% | 75.9% |
| Range | 63.8% | 51.1% |
| Mean | 67.9% | 48.7% |
| Median | 68.0% | 47.9% |
| Interquartile 25% (IQ1) | 56.0% | 40.0% |
| Interquartile 75% (IQ3) | 78.7% | 56.9% |
| Interquartile Range (IQR) | 22.8% | 16.9% |
| Standard Deviation (Sample) | 15.4% | 11.1% |
| Standard Deviation (Population) | 15.2% | 11.0% |
Similar Demographics by College, Under 1 year
Demographics Similar to Immigrants from South Africa by College, Under 1 year
In terms of college, under 1 year, the demographic groups most similar to Immigrants from South Africa are Estonian (70.6%, a difference of 0.020%), Russian (70.5%, a difference of 0.10%), Immigrants from Sri Lanka (70.5%, a difference of 0.16%), Turkish (70.7%, a difference of 0.17%), and Indian (Asian) (70.8%, a difference of 0.25%).
| Demographics | Rating | Rank | College, Under 1 year |
| Immigrants | Denmark | 100.0 /100 | #26 | Exceptional 71.0% |
| Immigrants | Ireland | 100.0 /100 | #27 | Exceptional 71.0% |
| Immigrants | Hong Kong | 100.0 /100 | #28 | Exceptional 71.0% |
| Immigrants | France | 100.0 /100 | #29 | Exceptional 71.0% |
| Immigrants | China | 99.9 /100 | #30 | Exceptional 70.9% |
| Indians (Asian) | 99.9 /100 | #31 | Exceptional 70.8% |
| Turks | 99.9 /100 | #32 | Exceptional 70.7% |
| Immigrants | South Africa | 99.9 /100 | #33 | Exceptional 70.6% |
| Estonians | 99.9 /100 | #34 | Exceptional 70.6% |
| Russians | 99.9 /100 | #35 | Exceptional 70.5% |
| Immigrants | Sri Lanka | 99.9 /100 | #36 | Exceptional 70.5% |
| Immigrants | Saudi Arabia | 99.9 /100 | #37 | Exceptional 70.4% |
| Australians | 99.9 /100 | #38 | Exceptional 70.4% |
| Bhutanese | 99.9 /100 | #39 | Exceptional 70.3% |
| Immigrants | Turkey | 99.9 /100 | #40 | Exceptional 70.3% |
Demographics Similar to Lumbee by College, Under 1 year
In terms of college, under 1 year, the demographic groups most similar to Lumbee are Immigrants from Dominican Republic (54.0%, a difference of 0.40%), Immigrants from Central America (54.4%, a difference of 0.41%), Spanish American Indian (54.0%, a difference of 0.49%), Pennsylvania German (54.5%, a difference of 0.56%), and Inupiat (54.6%, a difference of 0.73%).
| Demographics | Rating | Rank | College, Under 1 year |
| Dominicans | 0.0 /100 | #331 | Tragic 55.5% |
| Immigrants | Yemen | 0.0 /100 | #332 | Tragic 55.3% |
| Yuman | 0.0 /100 | #333 | Tragic 55.1% |
| Immigrants | Azores | 0.0 /100 | #334 | Tragic 54.7% |
| Inupiat | 0.0 /100 | #335 | Tragic 54.6% |
| Pennsylvania Germans | 0.0 /100 | #336 | Tragic 54.5% |
| Immigrants | Central America | 0.0 /100 | #337 | Tragic 54.4% |
| Lumbee | 0.0 /100 | #338 | Tragic 54.2% |
| Immigrants | Dominican Republic | 0.0 /100 | #339 | Tragic 54.0% |
| Spanish American Indians | 0.0 /100 | #340 | Tragic 54.0% |
| Immigrants | Cabo Verde | 0.0 /100 | #341 | Tragic 53.7% |
| Immigrants | Mexico | 0.0 /100 | #342 | Tragic 53.7% |
| Tohono O'odham | 0.0 /100 | #343 | Tragic 52.8% |
| Yakama | 0.0 /100 | #344 | Tragic 52.6% |
| Pima | 0.0 /100 | #345 | Tragic 51.4% |