Immigrants from Scotland vs Immigrants from Latvia Associate's Degree
COMPARE
Immigrants from Scotland
Immigrants from Latvia
Associate's Degree
Associate's Degree Comparison
Immigrants from Scotland
Immigrants from Latvia
50.6%
ASSOCIATE'S DEGREE
99.3/ 100
METRIC RATING
75th/ 347
METRIC RANK
52.8%
ASSOCIATE'S DEGREE
99.9/ 100
METRIC RATING
40th/ 347
METRIC RANK
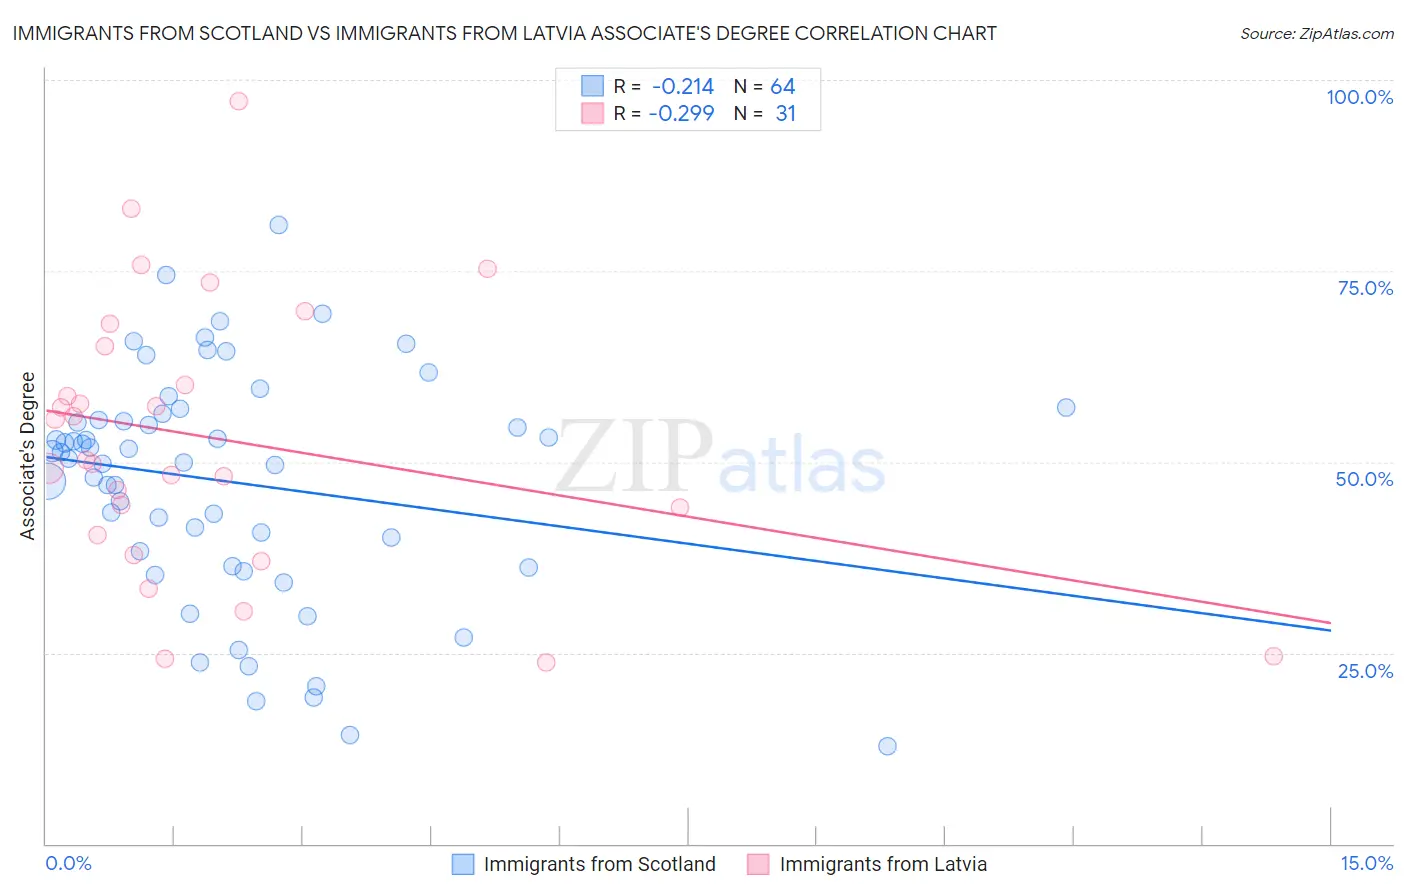
Immigrants from Scotland vs Immigrants from Latvia Associate's Degree Correlation Chart
The statistical analysis conducted on geographies consisting of 196,397,243 people shows a weak negative correlation between the proportion of Immigrants from Scotland and percentage of population with at least associate's degree education in the United States with a correlation coefficient (R) of -0.214 and weighted average of 50.6%. Similarly, the statistical analysis conducted on geographies consisting of 113,735,345 people shows a weak negative correlation between the proportion of Immigrants from Latvia and percentage of population with at least associate's degree education in the United States with a correlation coefficient (R) of -0.299 and weighted average of 52.8%, a difference of 4.3%.
Associate's Degree Correlation Summary
| Measurement | Immigrants from Scotland | Immigrants from Latvia |
| Minimum | 12.7% | 23.7% |
| Maximum | 81.0% | 97.2% |
| Range | 68.2% | 73.5% |
| Mean | 47.4% | 53.0% |
| Median | 50.9% | 50.3% |
| Interquartile 25% (IQ1) | 37.3% | 40.4% |
| Interquartile 75% (IQ3) | 55.9% | 65.2% |
| Interquartile Range (IQR) | 18.6% | 24.8% |
| Standard Deviation (Sample) | 15.1% | 17.7% |
| Standard Deviation (Population) | 14.9% | 17.4% |
Similar Demographics by Associate's Degree
Demographics Similar to Immigrants from Scotland by Associate's Degree
In terms of associate's degree, the demographic groups most similar to Immigrants from Scotland are Lithuanian (50.6%, a difference of 0.040%), Carpatho Rusyn (50.6%, a difference of 0.10%), Immigrants from Zimbabwe (50.5%, a difference of 0.21%), Immigrants from Lebanon (50.5%, a difference of 0.24%), and Immigrants from Eastern Europe (50.5%, a difference of 0.29%).
| Demographics | Rating | Rank | Associate's Degree |
| Immigrants | Indonesia | 99.5 /100 | #68 | Exceptional 51.0% |
| Egyptians | 99.5 /100 | #69 | Exceptional 50.9% |
| Immigrants | Argentina | 99.5 /100 | #70 | Exceptional 50.9% |
| Immigrants | Romania | 99.5 /100 | #71 | Exceptional 50.9% |
| Immigrants | Pakistan | 99.5 /100 | #72 | Exceptional 50.9% |
| Carpatho Rusyns | 99.3 /100 | #73 | Exceptional 50.6% |
| Lithuanians | 99.3 /100 | #74 | Exceptional 50.6% |
| Immigrants | Scotland | 99.3 /100 | #75 | Exceptional 50.6% |
| Immigrants | Zimbabwe | 99.2 /100 | #76 | Exceptional 50.5% |
| Immigrants | Lebanon | 99.1 /100 | #77 | Exceptional 50.5% |
| Immigrants | Eastern Europe | 99.1 /100 | #78 | Exceptional 50.5% |
| Ethiopians | 99.1 /100 | #79 | Exceptional 50.4% |
| Armenians | 99.1 /100 | #80 | Exceptional 50.4% |
| Maltese | 99.1 /100 | #81 | Exceptional 50.4% |
| Greeks | 98.9 /100 | #82 | Exceptional 50.3% |
Demographics Similar to Immigrants from Latvia by Associate's Degree
In terms of associate's degree, the demographic groups most similar to Immigrants from Latvia are Immigrants from Belarus (52.8%, a difference of 0.070%), Mongolian (53.0%, a difference of 0.36%), Immigrants from Saudi Arabia (52.6%, a difference of 0.43%), Immigrants from Malaysia (52.5%, a difference of 0.46%), and Immigrants from South Africa (52.5%, a difference of 0.47%).
| Demographics | Rating | Rank | Associate's Degree |
| Israelis | 100.0 /100 | #33 | Exceptional 53.4% |
| Bulgarians | 100.0 /100 | #34 | Exceptional 53.3% |
| Russians | 100.0 /100 | #35 | Exceptional 53.2% |
| Immigrants | Russia | 100.0 /100 | #36 | Exceptional 53.1% |
| Immigrants | Denmark | 100.0 /100 | #37 | Exceptional 53.1% |
| Mongolians | 100.0 /100 | #38 | Exceptional 53.0% |
| Immigrants | Belarus | 99.9 /100 | #39 | Exceptional 52.8% |
| Immigrants | Latvia | 99.9 /100 | #40 | Exceptional 52.8% |
| Immigrants | Saudi Arabia | 99.9 /100 | #41 | Exceptional 52.6% |
| Immigrants | Malaysia | 99.9 /100 | #42 | Exceptional 52.5% |
| Immigrants | South Africa | 99.9 /100 | #43 | Exceptional 52.5% |
| Estonians | 99.9 /100 | #44 | Exceptional 52.5% |
| Immigrants | Lithuania | 99.9 /100 | #45 | Exceptional 52.4% |
| Immigrants | Bulgaria | 99.9 /100 | #46 | Exceptional 52.4% |
| Immigrants | Kuwait | 99.9 /100 | #47 | Exceptional 52.4% |