Immigrants from Central America vs Lithuanian Associate's Degree
COMPARE
Immigrants from Central America
Lithuanian
Associate's Degree
Associate's Degree Comparison
Immigrants from Central America
Lithuanians
35.0%
ASSOCIATE'S DEGREE
0.0/ 100
METRIC RATING
332nd/ 347
METRIC RANK
50.6%
ASSOCIATE'S DEGREE
99.3/ 100
METRIC RATING
74th/ 347
METRIC RANK
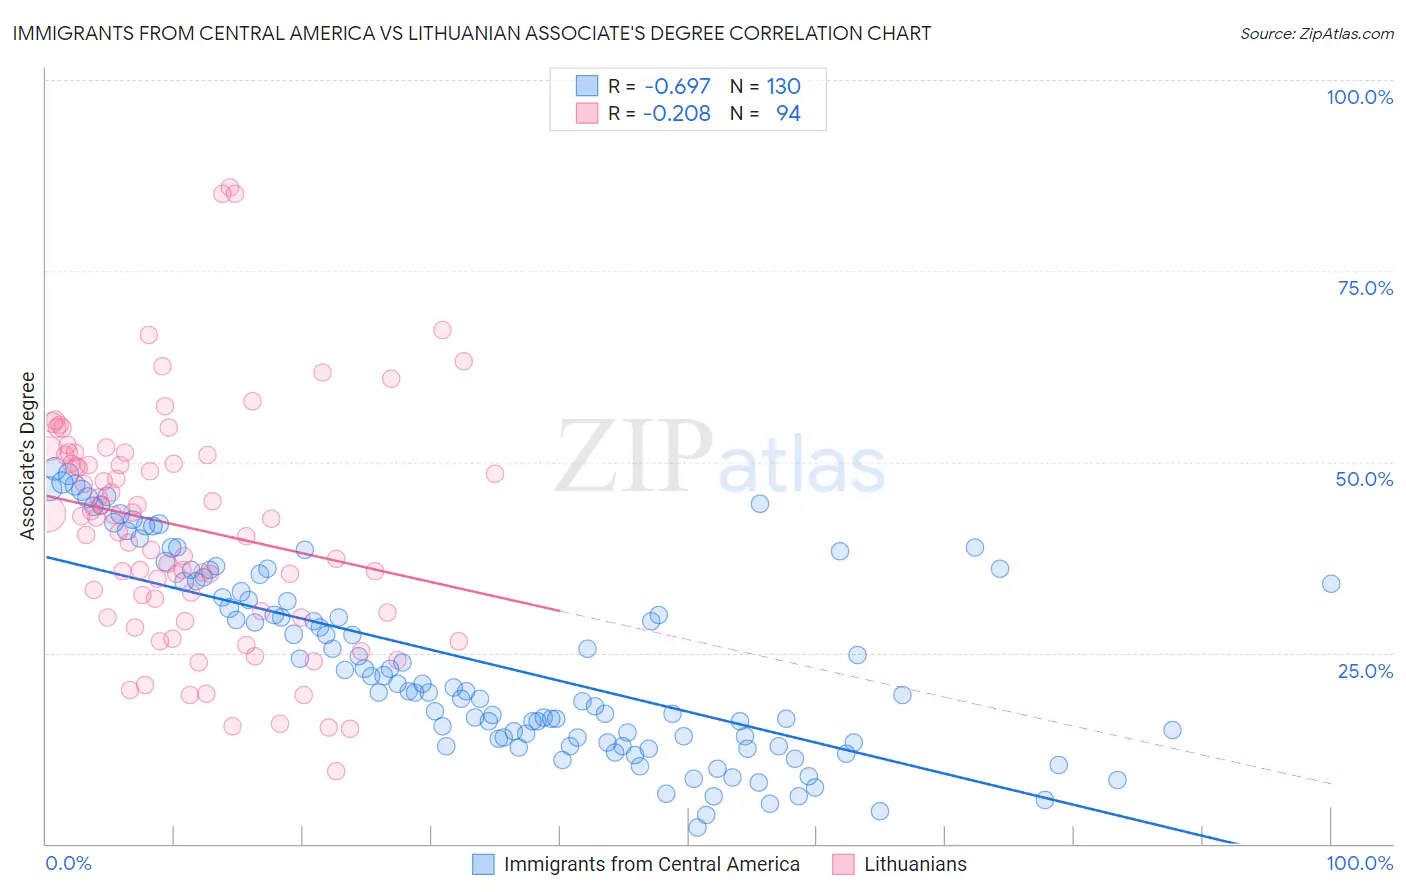
Immigrants from Central America vs Lithuanian Associate's Degree Correlation Chart
The statistical analysis conducted on geographies consisting of 536,468,789 people shows a significant negative correlation between the proportion of Immigrants from Central America and percentage of population with at least associate's degree education in the United States with a correlation coefficient (R) of -0.697 and weighted average of 35.0%. Similarly, the statistical analysis conducted on geographies consisting of 421,924,512 people shows a weak negative correlation between the proportion of Lithuanians and percentage of population with at least associate's degree education in the United States with a correlation coefficient (R) of -0.208 and weighted average of 50.6%, a difference of 44.6%.
Associate's Degree Correlation Summary
| Measurement | Immigrants from Central America | Lithuanian |
| Minimum | 2.2% | 9.5% |
| Maximum | 49.1% | 85.9% |
| Range | 46.9% | 76.4% |
| Mean | 23.8% | 41.4% |
| Median | 20.7% | 42.6% |
| Interquartile 25% (IQ1) | 13.9% | 30.2% |
| Interquartile 75% (IQ3) | 34.4% | 50.9% |
| Interquartile Range (IQR) | 20.5% | 20.7% |
| Standard Deviation (Sample) | 12.4% | 15.3% |
| Standard Deviation (Population) | 12.4% | 15.3% |
Similar Demographics by Associate's Degree
Demographics Similar to Immigrants from Central America by Associate's Degree
In terms of associate's degree, the demographic groups most similar to Immigrants from Central America are Mexican (35.0%, a difference of 0.080%), Native/Alaskan (34.9%, a difference of 0.31%), Spanish American Indian (34.9%, a difference of 0.45%), Hopi (34.6%, a difference of 1.3%), and Immigrants from the Azores (35.6%, a difference of 1.8%).
| Demographics | Rating | Rank | Associate's Degree |
| Menominee | 0.0 /100 | #325 | Tragic 36.7% |
| Kiowa | 0.0 /100 | #326 | Tragic 36.5% |
| Dutch West Indians | 0.0 /100 | #327 | Tragic 36.5% |
| Alaskan Athabascans | 0.0 /100 | #328 | Tragic 36.5% |
| Paiute | 0.0 /100 | #329 | Tragic 36.4% |
| Apache | 0.0 /100 | #330 | Tragic 36.2% |
| Immigrants | Azores | 0.0 /100 | #331 | Tragic 35.6% |
| Immigrants | Central America | 0.0 /100 | #332 | Tragic 35.0% |
| Mexicans | 0.0 /100 | #333 | Tragic 35.0% |
| Natives/Alaskans | 0.0 /100 | #334 | Tragic 34.9% |
| Spanish American Indians | 0.0 /100 | #335 | Tragic 34.9% |
| Hopi | 0.0 /100 | #336 | Tragic 34.6% |
| Lumbee | 0.0 /100 | #337 | Tragic 34.1% |
| Pueblo | 0.0 /100 | #338 | Tragic 34.0% |
| Immigrants | Mexico | 0.0 /100 | #339 | Tragic 33.7% |
Demographics Similar to Lithuanians by Associate's Degree
In terms of associate's degree, the demographic groups most similar to Lithuanians are Immigrants from Scotland (50.6%, a difference of 0.040%), Carpatho Rusyn (50.6%, a difference of 0.060%), Immigrants from Zimbabwe (50.5%, a difference of 0.25%), Immigrants from Lebanon (50.5%, a difference of 0.28%), and Immigrants from Eastern Europe (50.5%, a difference of 0.33%).
| Demographics | Rating | Rank | Associate's Degree |
| Argentineans | 99.6 /100 | #67 | Exceptional 51.2% |
| Immigrants | Indonesia | 99.5 /100 | #68 | Exceptional 51.0% |
| Egyptians | 99.5 /100 | #69 | Exceptional 50.9% |
| Immigrants | Argentina | 99.5 /100 | #70 | Exceptional 50.9% |
| Immigrants | Romania | 99.5 /100 | #71 | Exceptional 50.9% |
| Immigrants | Pakistan | 99.5 /100 | #72 | Exceptional 50.9% |
| Carpatho Rusyns | 99.3 /100 | #73 | Exceptional 50.6% |
| Lithuanians | 99.3 /100 | #74 | Exceptional 50.6% |
| Immigrants | Scotland | 99.3 /100 | #75 | Exceptional 50.6% |
| Immigrants | Zimbabwe | 99.2 /100 | #76 | Exceptional 50.5% |
| Immigrants | Lebanon | 99.1 /100 | #77 | Exceptional 50.5% |
| Immigrants | Eastern Europe | 99.1 /100 | #78 | Exceptional 50.5% |
| Ethiopians | 99.1 /100 | #79 | Exceptional 50.4% |
| Armenians | 99.1 /100 | #80 | Exceptional 50.4% |
| Maltese | 99.1 /100 | #81 | Exceptional 50.4% |