Icelander vs Lithuanian Associate's Degree
COMPARE
Icelander
Lithuanian
Associate's Degree
Associate's Degree Comparison
Icelanders
Lithuanians
48.3%
ASSOCIATE'S DEGREE
90.8/ 100
METRIC RATING
131st/ 347
METRIC RANK
50.6%
ASSOCIATE'S DEGREE
99.3/ 100
METRIC RATING
74th/ 347
METRIC RANK
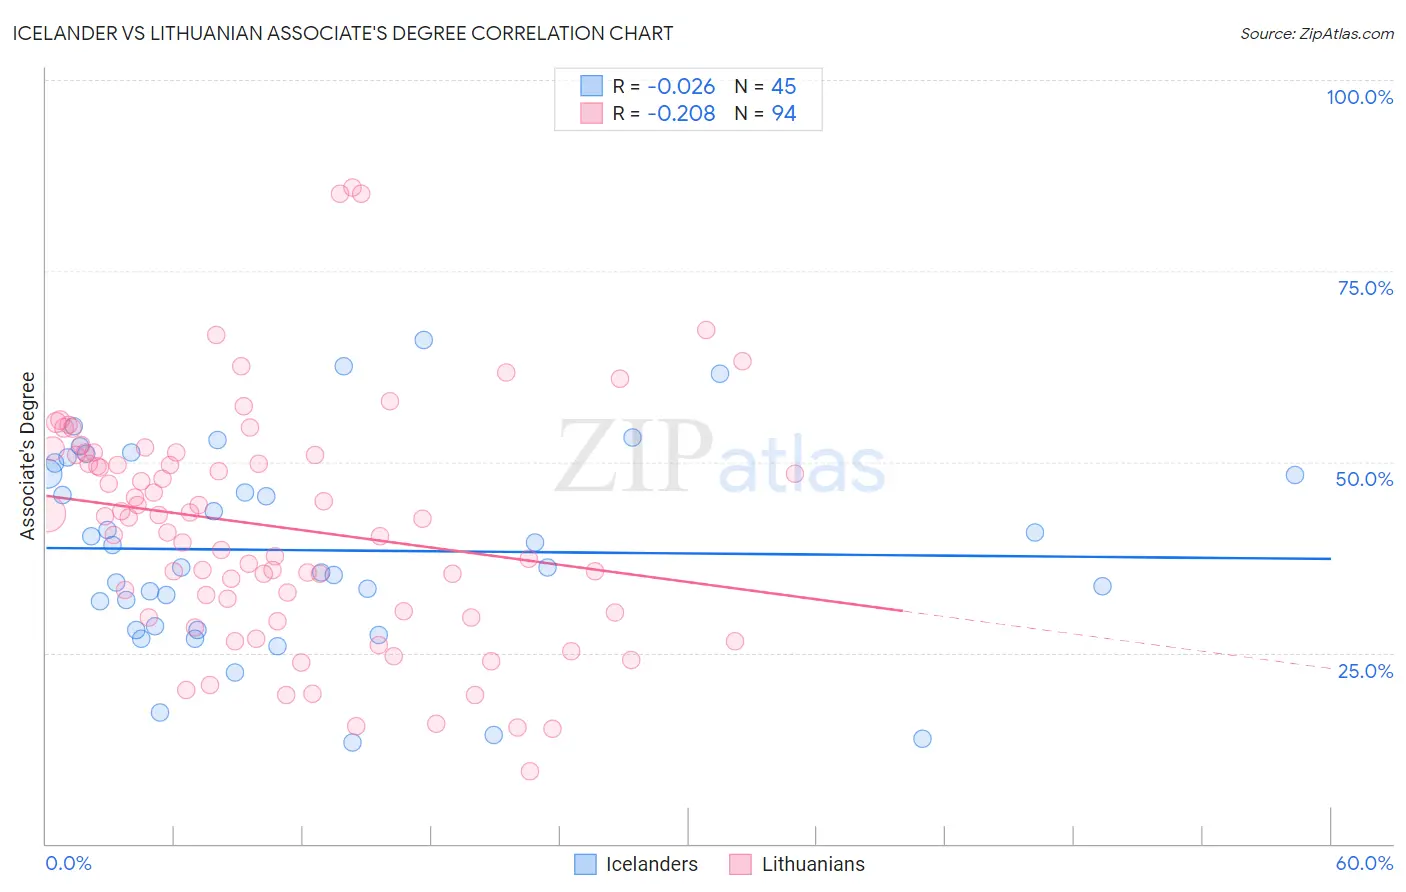
Icelander vs Lithuanian Associate's Degree Correlation Chart
The statistical analysis conducted on geographies consisting of 159,662,338 people shows no correlation between the proportion of Icelanders and percentage of population with at least associate's degree education in the United States with a correlation coefficient (R) of -0.026 and weighted average of 48.3%. Similarly, the statistical analysis conducted on geographies consisting of 421,924,512 people shows a weak negative correlation between the proportion of Lithuanians and percentage of population with at least associate's degree education in the United States with a correlation coefficient (R) of -0.208 and weighted average of 50.6%, a difference of 4.7%.
Associate's Degree Correlation Summary
| Measurement | Icelander | Lithuanian |
| Minimum | 13.3% | 9.5% |
| Maximum | 66.0% | 85.9% |
| Range | 52.6% | 76.4% |
| Mean | 38.4% | 41.4% |
| Median | 36.2% | 42.6% |
| Interquartile 25% (IQ1) | 28.2% | 30.2% |
| Interquartile 75% (IQ3) | 49.1% | 50.9% |
| Interquartile Range (IQR) | 20.9% | 20.7% |
| Standard Deviation (Sample) | 13.0% | 15.3% |
| Standard Deviation (Population) | 12.8% | 15.3% |
Similar Demographics by Associate's Degree
Demographics Similar to Icelanders by Associate's Degree
In terms of associate's degree, the demographic groups most similar to Icelanders are Immigrants from Jordan (48.4%, a difference of 0.10%), Swedish (48.4%, a difference of 0.16%), Immigrants from Albania (48.2%, a difference of 0.18%), Immigrants from Eastern Africa (48.4%, a difference of 0.19%), and Assyrian/Chaldean/Syriac (48.2%, a difference of 0.27%).
| Demographics | Rating | Rank | Associate's Degree |
| Serbians | 92.6 /100 | #124 | Exceptional 48.5% |
| Chinese | 92.5 /100 | #125 | Exceptional 48.5% |
| Immigrants | Syria | 92.2 /100 | #126 | Exceptional 48.5% |
| Immigrants | Uganda | 92.1 /100 | #127 | Exceptional 48.5% |
| Immigrants | Eastern Africa | 91.6 /100 | #128 | Exceptional 48.4% |
| Swedes | 91.5 /100 | #129 | Exceptional 48.4% |
| Immigrants | Jordan | 91.2 /100 | #130 | Exceptional 48.4% |
| Icelanders | 90.8 /100 | #131 | Exceptional 48.3% |
| Immigrants | Albania | 89.9 /100 | #132 | Excellent 48.2% |
| Assyrians/Chaldeans/Syriacs | 89.4 /100 | #133 | Excellent 48.2% |
| Moroccans | 89.3 /100 | #134 | Excellent 48.2% |
| Europeans | 89.0 /100 | #135 | Excellent 48.2% |
| Pakistanis | 88.0 /100 | #136 | Excellent 48.1% |
| Immigrants | Eritrea | 87.8 /100 | #137 | Excellent 48.1% |
| Poles | 87.3 /100 | #138 | Excellent 48.0% |
Demographics Similar to Lithuanians by Associate's Degree
In terms of associate's degree, the demographic groups most similar to Lithuanians are Immigrants from Scotland (50.6%, a difference of 0.040%), Carpatho Rusyn (50.6%, a difference of 0.060%), Immigrants from Zimbabwe (50.5%, a difference of 0.25%), Immigrants from Lebanon (50.5%, a difference of 0.28%), and Immigrants from Eastern Europe (50.5%, a difference of 0.33%).
| Demographics | Rating | Rank | Associate's Degree |
| Argentineans | 99.6 /100 | #67 | Exceptional 51.2% |
| Immigrants | Indonesia | 99.5 /100 | #68 | Exceptional 51.0% |
| Egyptians | 99.5 /100 | #69 | Exceptional 50.9% |
| Immigrants | Argentina | 99.5 /100 | #70 | Exceptional 50.9% |
| Immigrants | Romania | 99.5 /100 | #71 | Exceptional 50.9% |
| Immigrants | Pakistan | 99.5 /100 | #72 | Exceptional 50.9% |
| Carpatho Rusyns | 99.3 /100 | #73 | Exceptional 50.6% |
| Lithuanians | 99.3 /100 | #74 | Exceptional 50.6% |
| Immigrants | Scotland | 99.3 /100 | #75 | Exceptional 50.6% |
| Immigrants | Zimbabwe | 99.2 /100 | #76 | Exceptional 50.5% |
| Immigrants | Lebanon | 99.1 /100 | #77 | Exceptional 50.5% |
| Immigrants | Eastern Europe | 99.1 /100 | #78 | Exceptional 50.5% |
| Ethiopians | 99.1 /100 | #79 | Exceptional 50.4% |
| Armenians | 99.1 /100 | #80 | Exceptional 50.4% |
| Maltese | 99.1 /100 | #81 | Exceptional 50.4% |