Immigrants from Romania vs Dominican College, 1 year or more
COMPARE
Immigrants from Romania
Dominican
College, 1 year or more
College, 1 year or more Comparison
Immigrants from Romania
Dominicans
63.3%
COLLEGE, 1 YEAR OR MORE
99.3/ 100
METRIC RATING
67th/ 347
METRIC RANK
50.6%
COLLEGE, 1 YEAR OR MORE
0.0/ 100
METRIC RATING
326th/ 347
METRIC RANK
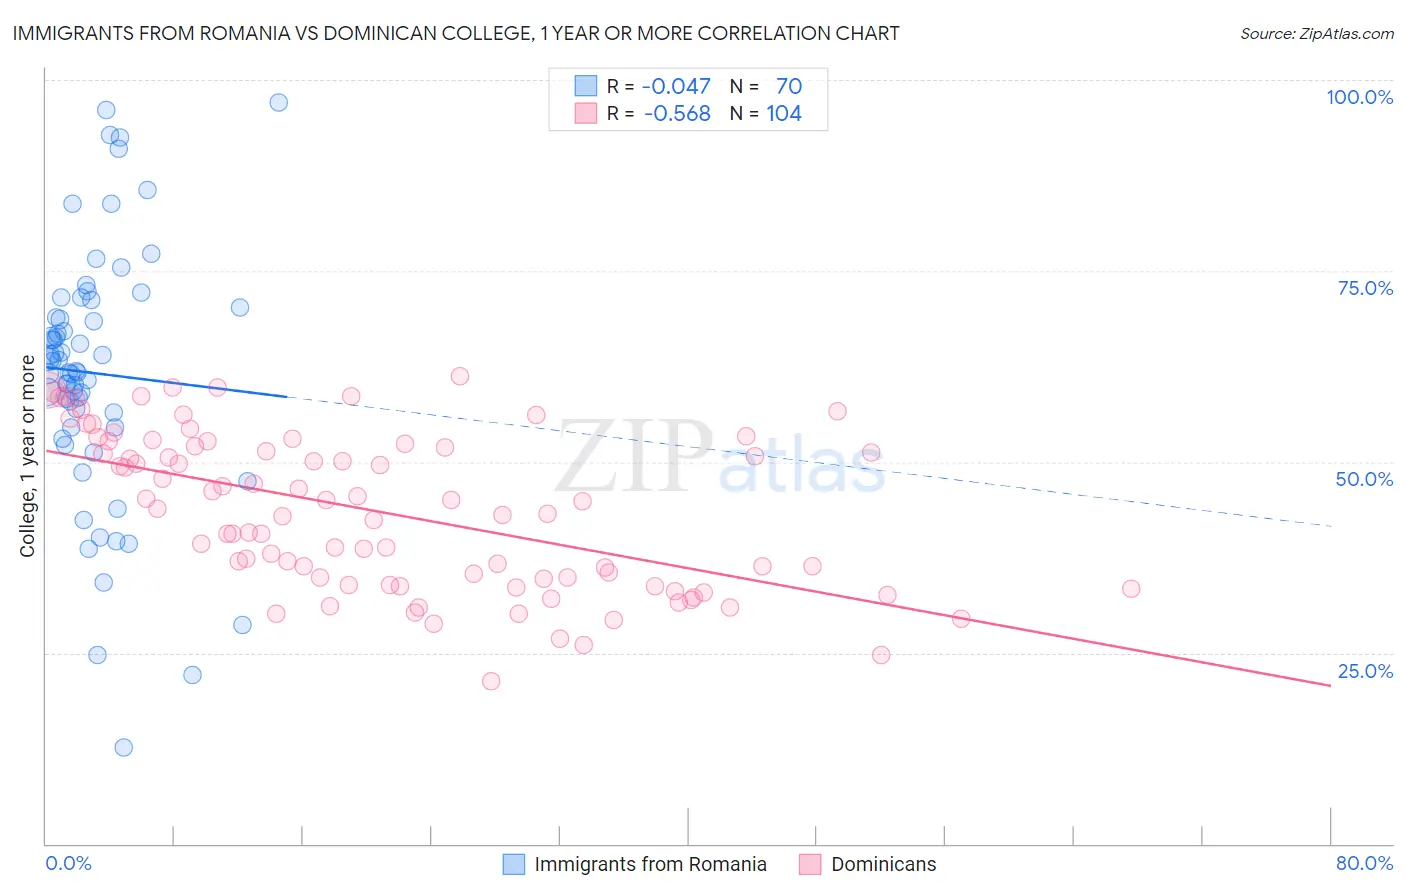
Immigrants from Romania vs Dominican College, 1 year or more Correlation Chart
The statistical analysis conducted on geographies consisting of 257,014,354 people shows no correlation between the proportion of Immigrants from Romania and percentage of population with at least college, 1 year or more education in the United States with a correlation coefficient (R) of -0.047 and weighted average of 63.3%. Similarly, the statistical analysis conducted on geographies consisting of 355,140,033 people shows a substantial negative correlation between the proportion of Dominicans and percentage of population with at least college, 1 year or more education in the United States with a correlation coefficient (R) of -0.568 and weighted average of 50.6%, a difference of 25.1%.
College, 1 year or more Correlation Summary
| Measurement | Immigrants from Romania | Dominican |
| Minimum | 12.7% | 21.3% |
| Maximum | 97.0% | 61.3% |
| Range | 84.3% | 40.0% |
| Mean | 61.6% | 43.4% |
| Median | 62.6% | 43.6% |
| Interquartile 25% (IQ1) | 54.6% | 34.3% |
| Interquartile 75% (IQ3) | 70.2% | 52.2% |
| Interquartile Range (IQR) | 15.6% | 17.8% |
| Standard Deviation (Sample) | 16.7% | 10.1% |
| Standard Deviation (Population) | 16.5% | 10.1% |
Similar Demographics by College, 1 year or more
Demographics Similar to Immigrants from Romania by College, 1 year or more
In terms of college, 1 year or more, the demographic groups most similar to Immigrants from Romania are Immigrants from Europe (63.3%, a difference of 0.020%), Immigrants from Greece (63.3%, a difference of 0.020%), Immigrants from Zimbabwe (63.3%, a difference of 0.020%), Maltese (63.4%, a difference of 0.12%), and Argentinean (63.2%, a difference of 0.12%).
| Demographics | Rating | Rank | College, 1 year or more |
| Immigrants | Kazakhstan | 99.5 /100 | #60 | Exceptional 63.6% |
| Bolivians | 99.5 /100 | #61 | Exceptional 63.5% |
| Immigrants | Indonesia | 99.5 /100 | #62 | Exceptional 63.5% |
| Immigrants | Scotland | 99.4 /100 | #63 | Exceptional 63.4% |
| Immigrants | Spain | 99.4 /100 | #64 | Exceptional 63.4% |
| Maltese | 99.3 /100 | #65 | Exceptional 63.4% |
| Immigrants | Europe | 99.3 /100 | #66 | Exceptional 63.3% |
| Immigrants | Romania | 99.3 /100 | #67 | Exceptional 63.3% |
| Immigrants | Greece | 99.3 /100 | #68 | Exceptional 63.3% |
| Immigrants | Zimbabwe | 99.3 /100 | #69 | Exceptional 63.3% |
| Argentineans | 99.2 /100 | #70 | Exceptional 63.2% |
| Immigrants | Canada | 99.1 /100 | #71 | Exceptional 63.1% |
| Egyptians | 99.0 /100 | #72 | Exceptional 63.1% |
| Immigrants | Moldova | 99.0 /100 | #73 | Exceptional 63.0% |
| Immigrants | North America | 99.0 /100 | #74 | Exceptional 63.0% |
Demographics Similar to Dominicans by College, 1 year or more
In terms of college, 1 year or more, the demographic groups most similar to Dominicans are Menominee (50.6%, a difference of 0.040%), Dutch West Indian (50.5%, a difference of 0.15%), Immigrants from Latin America (50.7%, a difference of 0.18%), Immigrants from Cuba (50.7%, a difference of 0.21%), and Immigrants from Guatemala (50.7%, a difference of 0.22%).
| Demographics | Rating | Rank | College, 1 year or more |
| Immigrants | El Salvador | 0.0 /100 | #319 | Tragic 51.0% |
| Kiowa | 0.0 /100 | #320 | Tragic 51.0% |
| Hopi | 0.0 /100 | #321 | Tragic 50.9% |
| Navajo | 0.0 /100 | #322 | Tragic 50.8% |
| Immigrants | Guatemala | 0.0 /100 | #323 | Tragic 50.7% |
| Immigrants | Cuba | 0.0 /100 | #324 | Tragic 50.7% |
| Immigrants | Latin America | 0.0 /100 | #325 | Tragic 50.7% |
| Dominicans | 0.0 /100 | #326 | Tragic 50.6% |
| Menominee | 0.0 /100 | #327 | Tragic 50.6% |
| Dutch West Indians | 0.0 /100 | #328 | Tragic 50.5% |
| Cape Verdeans | 0.0 /100 | #329 | Tragic 50.3% |
| Natives/Alaskans | 0.0 /100 | #330 | Tragic 50.2% |
| Immigrants | Yemen | 0.0 /100 | #331 | Tragic 50.0% |
| Mexicans | 0.0 /100 | #332 | Tragic 49.2% |
| Immigrants | Dominican Republic | 0.0 /100 | #333 | Tragic 49.1% |