Immigrants from Romania vs Yakama College, 1 year or more
COMPARE
Immigrants from Romania
Yakama
College, 1 year or more
College, 1 year or more Comparison
Immigrants from Romania
Yakama
63.3%
COLLEGE, 1 YEAR OR MORE
99.3/ 100
METRIC RATING
67th/ 347
METRIC RANK
46.2%
COLLEGE, 1 YEAR OR MORE
0.0/ 100
METRIC RATING
344th/ 347
METRIC RANK
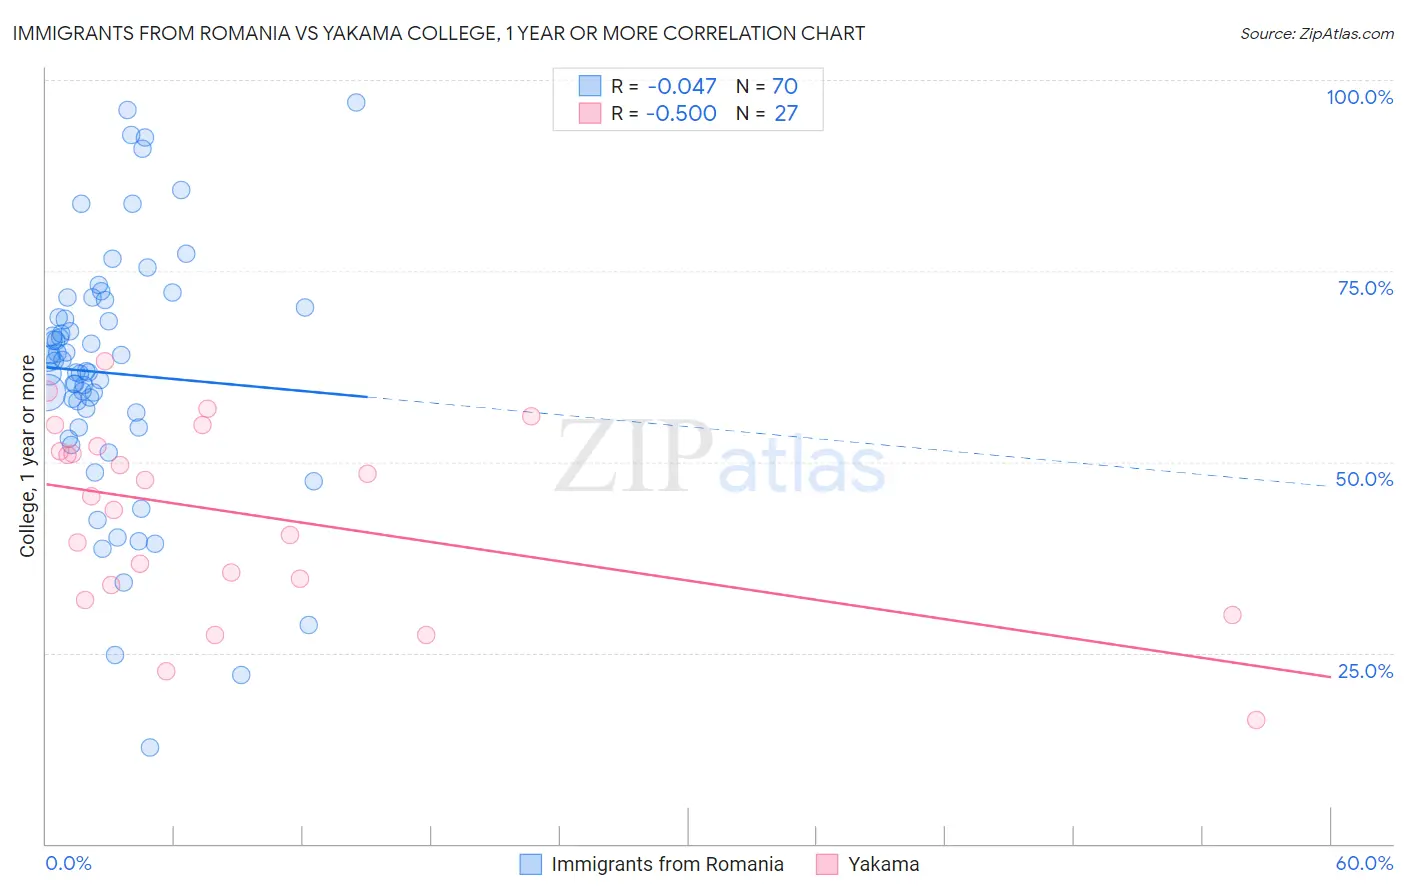
Immigrants from Romania vs Yakama College, 1 year or more Correlation Chart
The statistical analysis conducted on geographies consisting of 257,014,354 people shows no correlation between the proportion of Immigrants from Romania and percentage of population with at least college, 1 year or more education in the United States with a correlation coefficient (R) of -0.047 and weighted average of 63.3%. Similarly, the statistical analysis conducted on geographies consisting of 19,923,144 people shows a moderate negative correlation between the proportion of Yakama and percentage of population with at least college, 1 year or more education in the United States with a correlation coefficient (R) of -0.500 and weighted average of 46.2%, a difference of 36.9%.
College, 1 year or more Correlation Summary
| Measurement | Immigrants from Romania | Yakama |
| Minimum | 12.7% | 16.3% |
| Maximum | 97.0% | 63.1% |
| Range | 84.3% | 46.8% |
| Mean | 61.6% | 43.0% |
| Median | 62.6% | 45.5% |
| Interquartile 25% (IQ1) | 54.6% | 33.9% |
| Interquartile 75% (IQ3) | 70.2% | 52.0% |
| Interquartile Range (IQR) | 15.6% | 18.1% |
| Standard Deviation (Sample) | 16.7% | 12.2% |
| Standard Deviation (Population) | 16.5% | 12.0% |
Similar Demographics by College, 1 year or more
Demographics Similar to Immigrants from Romania by College, 1 year or more
In terms of college, 1 year or more, the demographic groups most similar to Immigrants from Romania are Immigrants from Europe (63.3%, a difference of 0.020%), Immigrants from Greece (63.3%, a difference of 0.020%), Immigrants from Zimbabwe (63.3%, a difference of 0.020%), Maltese (63.4%, a difference of 0.12%), and Argentinean (63.2%, a difference of 0.12%).
| Demographics | Rating | Rank | College, 1 year or more |
| Immigrants | Kazakhstan | 99.5 /100 | #60 | Exceptional 63.6% |
| Bolivians | 99.5 /100 | #61 | Exceptional 63.5% |
| Immigrants | Indonesia | 99.5 /100 | #62 | Exceptional 63.5% |
| Immigrants | Scotland | 99.4 /100 | #63 | Exceptional 63.4% |
| Immigrants | Spain | 99.4 /100 | #64 | Exceptional 63.4% |
| Maltese | 99.3 /100 | #65 | Exceptional 63.4% |
| Immigrants | Europe | 99.3 /100 | #66 | Exceptional 63.3% |
| Immigrants | Romania | 99.3 /100 | #67 | Exceptional 63.3% |
| Immigrants | Greece | 99.3 /100 | #68 | Exceptional 63.3% |
| Immigrants | Zimbabwe | 99.3 /100 | #69 | Exceptional 63.3% |
| Argentineans | 99.2 /100 | #70 | Exceptional 63.2% |
| Immigrants | Canada | 99.1 /100 | #71 | Exceptional 63.1% |
| Egyptians | 99.0 /100 | #72 | Exceptional 63.1% |
| Immigrants | Moldova | 99.0 /100 | #73 | Exceptional 63.0% |
| Immigrants | North America | 99.0 /100 | #74 | Exceptional 63.0% |
Demographics Similar to Yakama by College, 1 year or more
In terms of college, 1 year or more, the demographic groups most similar to Yakama are Pima (45.6%, a difference of 1.3%), Tohono O'odham (47.1%, a difference of 2.0%), Inupiat (47.2%, a difference of 2.2%), Immigrants from Mexico (47.5%, a difference of 2.8%), and Immigrants from Cabo Verde (48.1%, a difference of 4.0%).
| Demographics | Rating | Rank | College, 1 year or more |
| Immigrants | Dominican Republic | 0.0 /100 | #333 | Tragic 49.1% |
| Lumbee | 0.0 /100 | #334 | Tragic 48.9% |
| Yuman | 0.0 /100 | #335 | Tragic 48.7% |
| Spanish American Indians | 0.0 /100 | #336 | Tragic 48.5% |
| Pennsylvania Germans | 0.0 /100 | #337 | Tragic 48.5% |
| Immigrants | Central America | 0.0 /100 | #338 | Tragic 48.5% |
| Immigrants | Azores | 0.0 /100 | #339 | Tragic 48.4% |
| Immigrants | Cabo Verde | 0.0 /100 | #340 | Tragic 48.1% |
| Immigrants | Mexico | 0.0 /100 | #341 | Tragic 47.5% |
| Inupiat | 0.0 /100 | #342 | Tragic 47.2% |
| Tohono O'odham | 0.0 /100 | #343 | Tragic 47.1% |
| Yakama | 0.0 /100 | #344 | Tragic 46.2% |
| Pima | 0.0 /100 | #345 | Tragic 45.6% |
| Houma | 0.0 /100 | #346 | Tragic 41.2% |
| Yup'ik | 0.0 /100 | #347 | Tragic 39.4% |